WIT trade ideas
wipro bullish long termlong term invest ment bullish.
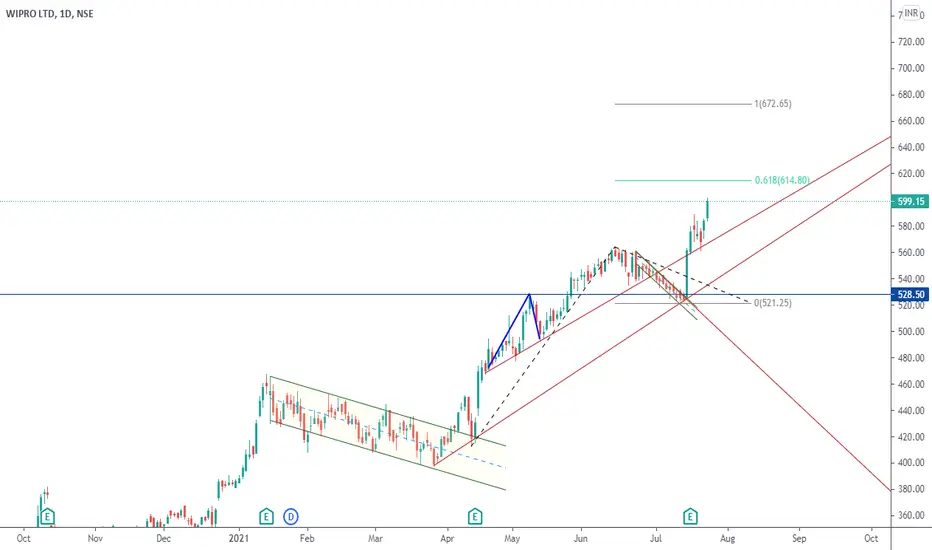
it is in channel until it touches the top trend line it is bullish.. for august after that it will be in correction.. and then again up movement

WIPRO SEEING A FLAG SHAPE ON 15 MINUTE CHART AFTER CORRECTION ON WIPRO IT MAKES A FLAG SHAPE ON 15 MINUTE CHART AS WE SEE ON THIS CHART IT MAKE HIGH OR RESISTANCE LEVEL AT 590 AND MAKE ALL TIME HIGH AT 601 WITH LOW 583 . SO, WE CAN TAKE AN OPPORTUINTY TO MAKE POSITION ON WIPRO ABOVE 590 WITH A STOP LOSS 580 FOR THE TGT OF 600 IMMEDIATELY .


Wipro trendline break and support betCan go long on wipro once it crosses its day's high. simple price action

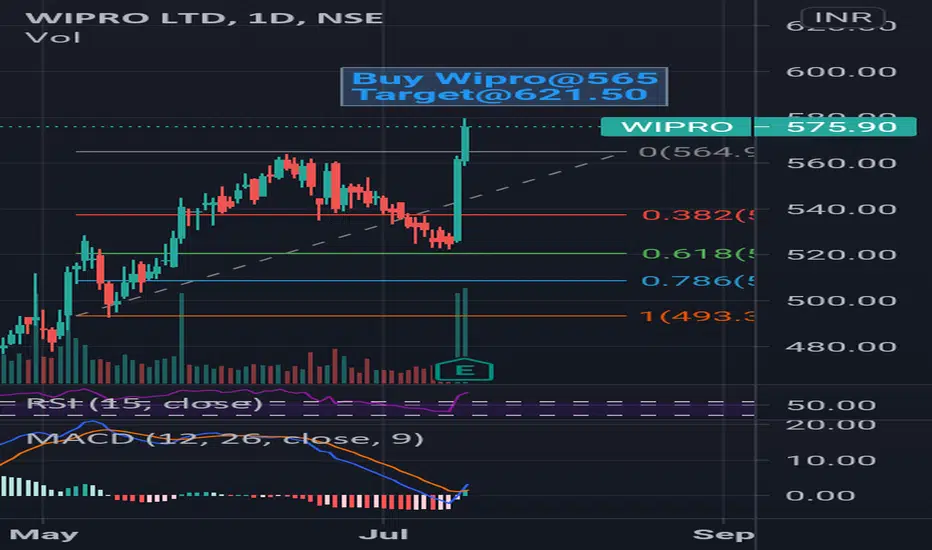
WIPRO | PositionalWipro has been on a bull run since the last two months, however the stock is now retracing for the last couple of weeks. The stock is now at a 50 MA position and it seems to be respecting the 50 MA for a long time. The RSI is in the oversold zone and MACD has started fading its negative momentum. The stock is taking support at 23% retracement.
Expecting the continuation of bull run in the coming days.
Idea - Positional
CMP- 526
Target - Next 50 MA crossover
SL - 513
Sharing for educational purpose only.


trade idea No 1. WIPROwipro probable end of correction.
horizantal line is support.
first vertical line day of buying.
second vertical line minimum holding period once above 543 or time stop if doesnt manage above 543.

Might reach till 620 to 670 by trend analysis I have used the trend analysis of the upward trend and felt like it would reach 620 or it can have a resistance at 560 which might get it into a consolidation stage.
But its highly unlikely as they are releasing their Q3 results tomorrow which is why the stocks are continuously rising.
As, its a software company and because of the pandemic software will keep growing as people have realized the importance of it.
All analysis done by me are just ideas which cannot guarantee you results and these are just ideas.
Please do not completely rely on my analysis and I suggest you to do your own analysis for better results.
Thank you !


WIPRO watch out and go looooooooongAlas !!!!!!!!!!!!! Third tech stock similar to TECHM and HCLTCH analysis. It appears that tech stock following specific trend!
Wipro completed Elliott corrective wave and begin new cycle of Impulse wave! Got good support at Fibonacci retracement level of 0.236 (410 ) .
watch out for breakout above triangle line.
If price moves above triangle, I will update T1 and T2.
If you are long time investor, cash out after 5 months (approximate time for completing New impulsive wave ).

Wipro may ConsolidateThere are chances for a bearish consolidation till mid August. A bounce back can be expected from 520 range

WIPRO BEARISH SIGNALHello Trader I Found WIPRO in Bearish Mode as we see there it formed Ascending channel In 1 HRS Time Frame it will come to its Supports Trendline. Please do your own analysis before taking any action if you find my analysis is useful for you please follow me and like me. Thank You


WIPRO ::: BULLISHDATE: 18 MAY 2021
INSTRUMENT: WIPRO
TREND: BUY
TIME FRAME: DAY
CMP: 508.05
BUY ABOVE: 515
STOP LOSS: 505
TGT 01: 524
TGT 02: 560
DISCLAIMER:
We are not S E B I registered analysts. Please consult your personal financial advisor before investing. We are not responsible for your profits/losses whatsoever.
Leave a comment that is helpful or encouraging. Let's master the markets together.


WiproA clear direction ⬆️ 590-600.but market can't go straight up or down.must need accumulate or distribution. Its fall hudge when drop.keep your sl always trials.


