NZDCHF | Range Idea | Pre-MarketWithin a 100K Account Balance the split on Trade & Risk Management = 1/10% - 1/20% margin as an Execution Range, to set up an Order Entry and select a per Trade on Average, to avoid any drawdown hit regarding to Stop Loss & to execute Risk on Management Specifics. Trail Stop efforts are a Focus of Attention to the set up in general when Volatile-Price-Action is involved, mainly because of the usage of an Intraday-Scalp-Position tool on behalf on the Trade Plan in general
# POSITION & Risk Reward | 15 Minutes Time Frame
- Measurement on Session
* Retracement | 0.5 & 0.618
* Extension | 0.88 & 1
# POSITION & Risk Reward | 1 Hour Time Frame
- Measurement on Session
* 20 EMA
* 1000 EMA
* Retracement
# TREND | TIME FRAME CONDUCTIVE | 4 Hour Time Frame
- Support & Resistance area 1
- Support & Resistance area 2
- Support & Resistance area 3
- Subdivision & General Trend
- Measurement on Session
* Retracement
* Support & Resistance
* Trade Area | Focus & Motion ahead
Active Sessions on Relevant Range & Elemented Probabilities;
* Asian(Ranging) - London(Upwards) - NYC(Downwards)
* Weekend Crypto Session
NZDCHF trade ideas

7 Dimension Sell Setup for NZDCHFCORE Analysis Method: Smart Money Concepts
😇 7 Dimension Analysis
Time Frame: H4
1️⃣ Swing Structure: Bearish with BOS
🟢 Impulsive Move: Started after the extreme POI mitigation.
🟢 Pullback: Inside the impulsive move, this is the first pullback, which might come back to take liquidity.
🟢 Internal Structure: 15 min is also bearish.
🟢 EXT OB: Used as POI in the Premier zone of the internal structure.
2️⃣ Pattern
🟢 CHART PATTERNS:
No specific chart patterns identified for this setup.
🟢 CANDLE PATTERNS:
Will be monitored once the price reaches the execution level.
3️⃣ Volume
🟢 Volume during correction: Needs monitoring, but generally, volume tends to dry up during corrections before increasing at points of interest.
4️⃣ Momentum RSI
🟢 Zone: In a bearish zone, confirming the bearish sentiment of the market.
5️⃣ Volatility Bollinger Bands
🟢 Current Phase: Monitoring needed for contraction or expansion phases. Band behavior indicates a possible breakout or continuation of the trend.
6️⃣ Strength: The market shows bearish strength without significant bullish interference.
7️⃣ Sentiment: Bearish.
✔️ Entry Time Frame: 15 min
✅ Entry TF Structure: Bearish
✔ Entry Time EXT OB: Is POI
💡 Decision: SELL
🚀 Entry: 0.5498
✋ Stop loss: 0.5505
🎯 Take profit: 0.5402
😊 Risk to reward Ratio: 13 RR
🕛 Expected Duration: 5 days
SUMMARY
The analysis identifies a bearish swing structure on the H4 time frame, marked by a Break of Structure (BOS) and an impulsive move starting after the extreme Point of Interest (POI) mitigation. Inside this impulsive move, the first pullback might come back to take liquidity. The internal structure on the 15-minute time frame is also bearish, using the extreme Order Block (OB) as the POI in the Premier zone of the internal structure.
There are no specific chart patterns identified for this setup. Candle patterns will be monitored once the price reaches the execution level. Volume analysis indicates that volume typically dries up during corrections before increasing at points of interest, which needs monitoring.
Momentum RSI is in a bearish zone, confirming the bearish sentiment of the market. Bollinger Bands indicate the need for monitoring contraction or expansion phases, suggesting a possible breakout or continuation of the trend.
The market shows bearish strength without significant bullish interference, with a general bearish sentiment. The entry time frame is 15 minutes, with the entry structure indicating bearishness and the POI filled with the EXT OB.
The decision is to sell at 0.5498, with a stop loss at 0.5505 and a take profit at 0.5402, providing a 13:1 risk to reward ratio. The expected duration for this trade setup is 5 days, based on market conditions and price behavior as outlined.

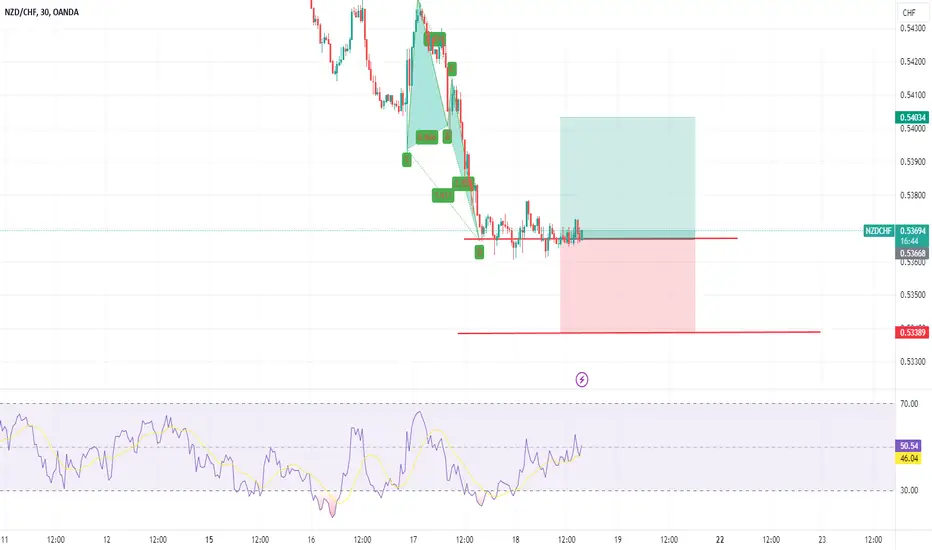
NZDCHF Potential UpsidesHey Traders, in today's trading session we are monitoring NZDCHF for a buying opportunity around 0.53350 zone, NZDCHF is trading in an uptrend and currently is in a correction phase in which it is approaching the trend at 0.53350 support and resistance area.
Trade safe, Joe.

NZDCHF LongPattern on M15 and M30
This is against the trend but there is a lot of consolidation
Oversold on all timeframes
Stop loss of 40 pips
Quick trade
NZDCHF - Wait For It...Hello TradingView Family / Fellow Traders. This is Richard, also known as theSignalyst.
📈NZDCHF has been overall bullish , trading within the flat rising wedge marked in blue.
Currently, NZDCHF is undergoing a correction phase in the shape of a falling channel in red.
Moreover, it is retesting massive support in green.
🏹 Thus, the highlighted blue circle is a strong area to look for trend-following buy setups as it is the intersection of the green support and lower blue/red trendlines acting as non-horizontal support.
📚 As per my trading style:
As #NZDCHF approaches the blue circle zone, I will be looking for bullish reversal setups (like a double bottom pattern, trendline break , and so on...)
📚 Always follow your trading plan regarding entry, risk management, and trade management.
Good luck!
All Strategies Are Good; If Managed Properly!
~Rich

NZD/CHF BULLISH BIAS RIGHT NOW| LONG
Hello, Friends!
Bullish trend on NZD/CHF, defined by the green colour of the last week candle combined with the fact the pair is oversold based on the BB lower band proximity, makes me expect a bullish rebound from the support line below and a retest of the local target above at 0.544.
✅LIKE AND COMMENT MY IDEAS✅

NZDCHF - Bullish Continuation - Support Trend LineOANDA:NZDCHF is currently trading at the support trend line after retracing in a bullish trend. Price should find support and start trending upwards noting current support is at Daily Fib 0.786 level!

NZD/CHF Bullish Gartley Pattern Suggests Uptrend PotentialBullish Gartley Harmonic Pattern Formation:
The NZD/CHF currency pair is currently forming a Bullish Gartley Harmonic Pattern, indicating potential upward movement. This pattern is aligned with a significant support area, reinforcing our bullish outlook.
Key Support and Trendline Confluence:
The price has received a strong rejection at this key support level, which coincides with a critical trendline and the 78.6% Fibonacci retracement level. This confluence of technical factors strengthens the likelihood of a bullish reversal.
RSI Divergence:
Adding to our bullish sentiment is the RSI divergence observed on the 4-hour time frame. The RSI is showing signs of divergence, suggesting a potential shift in momentum in favor of the bulls.
Trade Setup:
Entry Point: 0.54125
Stop Loss: 0.53460
Take Profit Targets:
TP-1: 0.54790
TP-2: 0.55455
TP-3: 0.56120
Conclusion:
Based on the alignment of the Bullish Gartley Harmonic Pattern, key support area, trendline, 78.6% Fibonacci retracement level, and RSI divergence, we anticipate a potential bullish move in the NZD/CHF pair. Traders should consider entering at the specified entry point with the given stop loss and take profit targets for an optimized risk-reward ratio.

NZDCHF area of interest So I do not advise following my positions.
I am buying NZDCHF here. I am doing 1 lot and i will add another lot to 1.5 lot if price does
in-fact hit that lower trend line. 2.5 lots here is currently paying about 18$ per day in positive carry. The interest differential here is wide and CHF has already implemented two rate cuts causing this pair to go all the way to .56
my targets are .56 and .5680
time horizon, the longer the better. as long as price doesn't make a lower low.

#2872024| NZDCHF Buying opportunity 1:8NZDCHF Buying opportunity Appears in H4 Time Frame Looking Price Action for Long Term Buy
Risk and Reward Ratio is 1:8
After 50 pips Profit Set SL Entry Level
"DISCLAIMER" Trading & investing business is "Very Profitable" as well as risky, so any trading or investment decision should be made after Consultation with Certified & Regulated Investment Advisors, by Carefully Considering your Financial Situation.

Fib ratio and uptrend continuationLooking price the recent structure and using the Fibonacci retracement price could still be in uptrend after a retest of the double bottom from lasts months low, bullish candle and price confirmation patterns could suggest a continuation to the upside with a price trend near Fib zone of 0.618 (0.54229) which is a sweet spot for entries. Price could also reach resistance (0.56209) and confirm a clear and complete bearish Bat pattern

NZDCHF What Next? BUY!
My dear subscribers,
My technical analysis for NZDCHF is below:
The price is coiling around a solid key level - 0.5400
Bias - Bullish
Technical Indicators: Pivot Points Lowanticipates a potential price reversal.
Super trend shows a clear buy, giving a perfect indicators' convergence.
Goal - 0.5426
My Stop Loss - 0.5385
About Used Indicators:
By the very nature of the supertrend indicator, it offers firm support and resistance levels for traders to enter and exit trades. Additionally, it also provides signals for setting stop losses
———————————
WISH YOU ALL LUCK

HERE IS STRONG POSITION WHERE YOU CAN BUY NOWBuy at the level where we place the pending order and here is the strong support where it confirm to test and regain it

NZDCHFThe Chart was printing a bearish trend but there is a divergence and need waiting for the chart to make first HH and Hl.

BULLISH NZDCHFIf you're not in on this trade then I suggest you start longing at this entry price range now... Daily impulse followed by our local pullback/correction in the market points us to the 0.618 golden ratio... Price also sitting and retesting a very strong Supply and Demand zone I could almost guarantee you'll see growth on this one, so traders lets make money here with the institutions hedge funds and big banks!!

NZDCHF Local Bullish Rebound!NZD-CHF is going down
Now but the pair is now
Oversold so I will be
Expecting a local rebound
From the horizontal support
Ahead at around 0.54110 !

NZDCHF - BEARISH MOVE Hello Traders !
The NZDCHF price reached a resistance level !
The Higher Low is Broken (Change of Character).
The support line was also broken
So, I predict a bearish move📉
___________
TARGET: 0.54230🎯

NZDCHF Long Setup: Buy Entry Near 0.5446/42 on 4-Hour ChartOn the monthly timeframe, last month's price action formed an inside bar, indicating consolidation without a clear bias, although the preceding month closed strongly bullish.
The weekly chart also shows an inside bar with a slight rejection from the bottom, but overall, there's no strong directional bias.
Daily price action reveals two consecutive ranging bars, suggesting opportunities to consider long positions from support levels or short positions from resistance.
On the 4-hour chart, I'm more inclined to go long from the identified support level.
Buy Entry : I plan to enter a long position around 0.5446/42 .
Stop Loss : I will set the stop loss below 0.5436 to manage risk effectively.
Take Profit : The target profit will be around 0.54813 .

Bearish drop?NZD/CHF has reacted off the pivot which is a pullback support and could drop to the 1st support which acts as a pullback support.
Pivot: 0.54475
1st Support: 0.54122
1st Resistance: 0.54745
Risk Warning:
Trading Forex and CFDs carries a high level of risk to your capital and you should only trade with money you can afford to lose. Trading Forex and CFDs may not be suitable for all investors, so please ensure that you fully understand the risks involved and seek independent advice if necessary.
Disclaimer:
The above opinions given constitute general market commentary, and do not constitute the opinion or advice of IC Markets or any form of personal or investment advice.
Any opinions, news, research, analyses, prices, other information, or links to third-party sites contained on this website are provided on an "as-is" basis, are intended only to be informative, is not an advice nor a recommendation, nor research, or a record of our trading prices, or an offer of, or solicitation for a transaction in any financial instrument and thus should not be treated as such. The information provided does not involve any specific investment objectives, financial situation and needs of any specific person who may receive it. Please be aware, that past performance is not a reliable indicator of future performance and/or results. Past Performance or Forward-looking scenarios based upon the reasonable beliefs of the third-party provider are not a guarantee of future performance. Actual results may differ materially from those anticipated in forward-looking or past performance statements. IC Markets makes no representation or warranty and assumes no liability as to the accuracy or completeness of the information provided, nor any loss arising from any investment based on a recommendation, forecast or any information supplied by any third-party.

NZD/CHF For Bearish after break current support areawait for break current support area and then go short
- General Trend is Down Trend
- wait for break current support area at green arrow and go short
have fun :)

NZDCHF Will Explode! BUY!
My dear friends,
Please, find my technical outlook for NZDCHF below:
The price is coiling around a solid key level - 0.5447
Bias - Bullish
Technical Indicators: Pivot Points Low anticipates a potential price reversal.
Super trend shows a clear buy, giving a perfect indicators' convergence.
Goal - 0.5476
Safe Stop Loss - 0.5428
About Used Indicators:
The pivot point itself is simply the average of the high, low and closing prices from the previous trading day.
———————————
WISH YOU ALL LUCK

NZDCHF The Target Is DOWN! SELL!
My dear friends,
Please, find my technical outlook for NZDCHF below:
The instrument tests an important psychological level 0.5485
Bias - Bearish
Technical Indicators: Supper Trend gives a precise Bearish signal, while Pivot Point HL predicts price changes and potential reversals in the market.
Target - 0.5463
About Used Indicators:
Super-trend indicator is more useful in trending markets where there are clear uptrends and downtrends in price.
———————————
WISH YOU ALL LUCK
