To the Moon: Space Isn't Just for Billionaires. It's for You TooTo your parents, getting involved in space meant joining NASA, becoming an astronaut, or — more realistically — building a scale model of the Saturn V and telling them you wanted to be "just like Neil Armstrong."
Today? You don’t need a PhD, perfect vision, or the ability to survive on dehydrated i

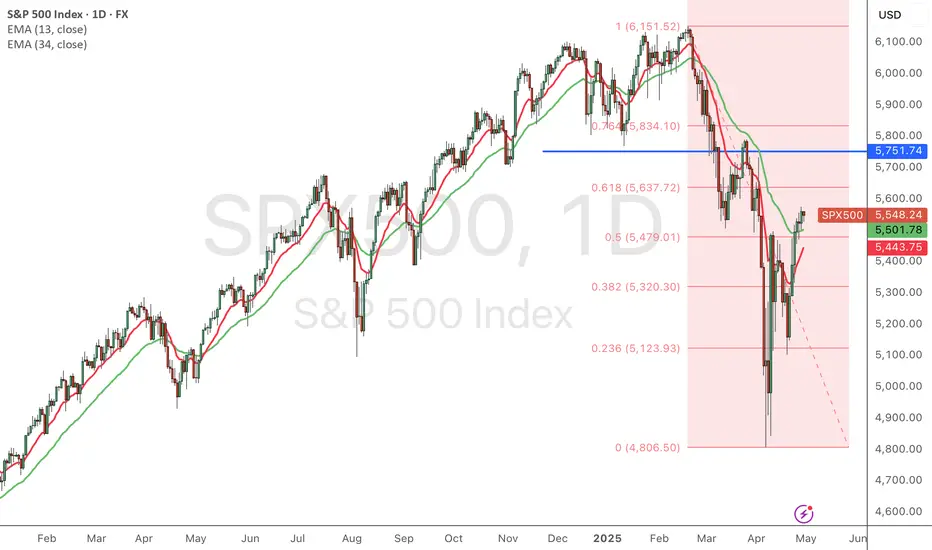
S&P500 - The bottom we have been waiting for!The S&P500 - TVC:SPX - officially created the bottom:
(click chart above to see the in depth analysis👆🏻)
This month we officially saw one of the craziest stock market fakeouts of the past decade. With a drop and reversal rally of about +15%, the S&P500 is about to even close with a green month

SPX Bullish Breakout and Wave 5 TargetSPX has successfully broken out of the rounding bottom pattern, confirming a strong bullish reversal. After completing waves 1 to 4 within the upward channel, the index is now poised to advance into Wave 5.
The current momentum supports a rally toward the immediate setup target near 6,690, with an

S&P 500 - Sell in May, return anther day. The truth - 2025No doubt everyone has heard a variation of the phrase:
“Sell in May, return another day.”
In Wikipedia it is written:
“Sell in May and go away is an investment strategy for stocks based on a theory (sometimes known as the Halloween indicator) that the period from November to April inclusive has s

US Stocks Pare Back All Tariff-Fueled Losses. Are We So Back?Remember “Liberation Day”? The one that felt more like Liquidation Day ? When markets tanked, tickers turned red, and you were afraid to check the markets on the next day? Well, turns out the rumors of the market’s demise were — once again — greatly exaggerated.
If the average recession 10 years a

S&P 500 records 9 days of gains, longest streak in 20 years🚨S&P 500 records 9th consecutive day of gains, the longest winning streak in over 20 years..
🚨
MartyBoots here , I have been trading for 17 years and sharing my thoughts on ETH here.
SP:SPX
Watch video for more details

SPX500 rebound will finish in the range of 5650 to 5750.Trump’s tweet on April 9 regarding the moderation of tariff measures triggered a strong market rebound. Retail investors are buying the dip, contributing to this recovery, while institutional investors are actually net sellers. In April, capital flowed out of U.S. equities and mid- to long-term U.S.
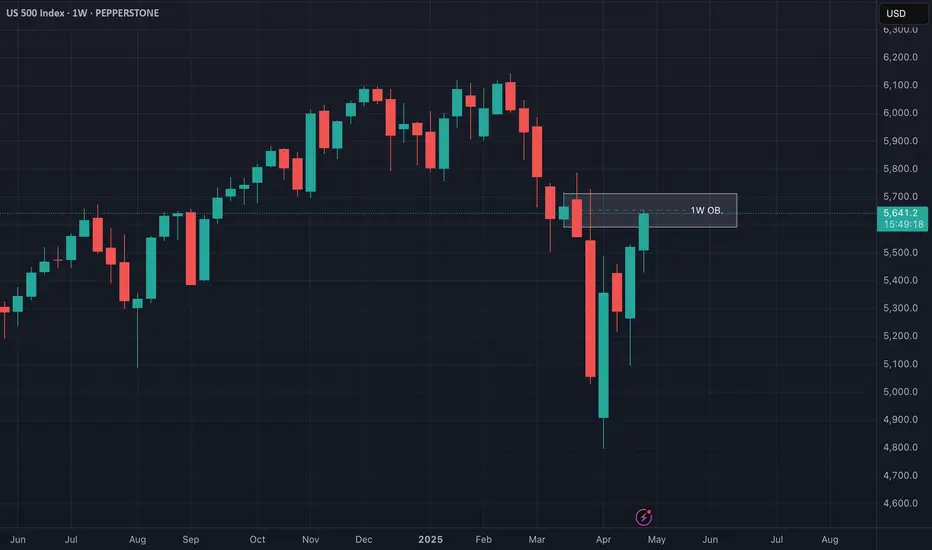
US500 at Critical Resistance - Weekly Chart Breakdown📊 US500 Weekly Chart Analysis
Taking a close look at the US500 on the weekly timeframe, we can see price has now traded directly into a bearish weekly order block 🧱 — a key distribution zone where smart money activity often emerges. At this level, the market is trading at a premium 💰 and appears to
Believe or Not- Blue SeasonBefore Donald Trump gets credit based on tariff's or anything like that I wanted to share the future of SPX 500 with everyone. It's definitely about to explode to a new all time high. Watch and learn. Market 101- Let's go USA!

Today is oct 14th 1929 I have moved back to Long puts at 105%The chart posted was in the forecast written dec 8th 2024 We have now reached my targets of 5669 area I have been buying the dips in calls and made $ I am now 105 % long in the money puts and I do Not see a bottom until july once we break and a second bottom mid oct The market should see a d

See all ideas
Displays a symbol's price movements over previous years to identify recurring trends.
Related indices
Frequently Asked Questions
S&P 500 Index reached its highest quote on Feb 19, 2025 — 6,152.5 USD. See more data on the S&P 500 Index chart.
The lowest ever quote of S&P 500 Index is 666.3 USD. It was reached on Mar 6, 2009. See more data on the S&P 500 Index chart.
S&P 500 Index is just a number that lets you track performance of the instruments comprising the index, so you can't invest in it directly. But you can buy S&P 500 Index futures or funds or invest in its components.