WTI CRUDE OIL(USOIL): Classic Gap TradeI see a nice gap down on USOIL, with a strong possibility that the gap will be filled soon.
The price approached an important support level and showed signs of a potential bullish signal.
I also observed a breakout of the neckline of an ascending triangle pattern on the hourly chart.
It is likely that USOIL will continue to rise and reach the 57.7 level in the near future.
OIL_CRUDE trade ideas

Fridays BULL RUN CONTINUATION, Sunday EntryFridays entry at Break of POi(Point of interest) 59.892
Entry 2: Sunday Night 10pm
price retested previous high 61.084
Previous high, turned into new price Low
SetUp: Retest, Break + CLose of 1hr wick (61.281
Entry:
stops below hourly Low (60.970]
TP: 63.135 : filled @ 3am EST London Session Open
+174 pips banked

USOIL What Next? SELL!
My dear subscribers,
This is my opinion on the USOIL next move:
The instrument tests an important psychological level 60.99
Bias - Bearish
Technical Indicators: Supper Trend gives a precise Bearish signal, while Pivot Point HL predicts price changes and potential reversals in the market.
Target - 58.63
My Stop Loss - 62.11
About Used Indicators:
On the subsequent day, trading above the pivot point is thought to indicate ongoing bullish sentiment, while trading below the pivot point indicates bearish sentiment.
Disclosure: I am part of Trade Nation's Influencer program and receive a monthly fee for using their TradingView charts in my analysis.
———————————
WISH YOU ALL LUCK

USOIL:Sharing of the Latest Trading StrategyAll the trading signals today have resulted in profits!!! Check it!!!👉👉👉
Due to the expectation that the China-US trade war has peaked, the oil price is expected to continue its rebound momentum and break through the level of $60 per barrel. However, the uncertainties of trade negotiations and the supply potential of Iran pose a dual pressure. In the short term, the fluctuations of the oil price will be more dominated by geopolitical factors and inventory dynamics. In terms of trading strategies, it is recommended to mainly go short on rebounds. In the short term, pay attention to the resistance at 61.0 above, and the support at 58.0 below.
Trading Strategy:
sell@61-60
TP:58.5-58
The signals in the Signature have brought about continuous profits, and accurate signals are shared every day. Hurry up and click to get them!
👇 👇 👇 Obtain signals👉👉👉

USOIL Today's strategyThe short-term trend of USOIL hit a new high, reaching around $63.5 before falling back and adjusting. The oil price broke below the moving average system, and the objective short-term trend direction has entered a transformation. In the MACD indicator, the fast and slow lines crossed below the zero axis, and the bearish momentum is quite strong. It is expected that after the oil price in the day falls back in line with the trend, it will obtain support near 60 and then rebound upwards.
USOIL
sell@62-62.5
tp:61-60.5
I am committed to sharing trading signals every day. Among them, real-time signals will be flexibly pushed according to market dynamics. All the signals sent out last week accurately matched the market trends, helping numerous traders achieve substantial profits. Regardless of your previous investment performance, I believe that with the support of my professional strategies and timely signals, I will surely be able to assist you in breaking through investment bottlenecks and achieving new breakthroughs in the trading field.

US-Oil will further push upside After Testing TrendlineAt present, the price of crude oil is above the key technical level, and the geopolitical sentiment has also become more favorable, so the short-term outlook for crude oil is bullish. If the upcoming Sino-US meeting leads to a relaxation of trade tensions, the upward momentum is likely to accelerate. Unless OPEC+ unexpectedly increases the supply, the target for the next few trading days may be set at $63 and higher. Crude oil opened lower this week and then rebounded. The weekly candlestick closed as a large positive candlestick, approaching the resistance of the 5-week moving average. On the daily chart, after the second pullback, the price rebounded upwards without breaking the low point. $64.80 is a key watershed. Below this level, there is still a possibility of a bearish trend. In the short term, the trend is bullish. Overall, it is expected to rise first and then fall next week. Pay attention to the resistance at $63.50 and go short, and set the stop-loss with the position of $64.80 for a bearish outlook.
you are currently struggling with losses, or are unsure which of the numerous trading strategies to follow, at this moment, you can choose to observe the operations within our channel.

TradingView Idea – Crude Oil (WTI) Technical Analysis:The USOIL H-2 Chart displays a classic Inverse Head and Shoulders pattern, signaling a potential bullish reversal. The neckline breakout confirms the pattern, suggesting upward momentum. A long position is considered with:
Entry: Near current price around $62.31
Target (Take Profit): $65.53 based on the pattern's projected move
Stop Loss: Placed below the right shoulder at $60.48
favorable risk-to-reward ratio, aiming to capture the bullish breakout continuation.
Support: If you found this helpful, like and follow for more trade ideas!
Must Support Me Share My Idea With Your Firends Mention Your Feed back Comment Section
Note: This is not financial advice. Please conduct your own research and manage risk accordingly.


USOILCurrent USOIL Price Drop (May 2025)
WTI crude oil (USOIL) has declined sharply in early May 2025, Key drivers include:
OPEC+ Surprise Supply Increase: OPEC+ announced plans to raise output in June, reversing earlier production cuts and flooding the market with additional barrels.
Tariff-Driven Demand Fears: U.S.-China trade tensions and retaliatory tariffs threaten global economic growth, reducing oil demand forecasts.
Dollar Strength: The U.S. dollar (DXY) has rebounded due to delayed Fed rate cuts and safe-haven demand, pressuring dollar-denominated oil prices.
EIA/Goldman Sachs Forecasts: The U.S. Energy Information Administration (EIA) and Goldman Sachs revised 2025–2026 oil price forecasts downward, citing oversupply risks and weaker demand.
Shifting Dollar-Oil Correlation
Historically, oil and the dollar were inversely correlated (strong dollar = lower oil prices). However, this relationship is weakening due to:
U.S. as a Net Oil Exporter: The U.S. is now the world’s largest crude producer. Higher oil prices improve the U.S. trade balance (vs. worsening it when the U.S. was a net importer).
Petrodollar Dynamics: As the U.S. exports more oil, revenue from oil sales strengthens the dollar, creating a positive correlation in certain scenarios.
Geopolitical and Policy Shocks: Tariffs, OPEC+ decisions, and Fed policy now dominate price action, overshadowing traditional correlations.
Future Directional Bias
Bearish Factors
OPEC+ Supply Surge: Increased production (post-June 2025) could push prices toward $50–$55/barrel (Goldman Sachs base case).
Recession Risks: Weak demand from China/Europe and U.S. tariff impacts may trigger a global slowdown, further depressing oil prices.
Dollar Strength: Fed rate cuts delayed until July 2025 or later could sustain dollar strength, capping oil’s upside.
Bullish Catalysts
Supply Disruptions: Escalating Middle East tensions or OPEC+ policy reversals could tighten supply.
Weaker Dollar: If the Fed signals rate cuts or tariffs ease, dollar weakness could lift oil prices.
Outlook:
USOIL faces downside risks in the near term due to oversupply and demand concern
Exogenous Shocks: Exogenous shocks to the U.S. real interest rate can cause a modest and short-lived decline in the real price of oil. Although there is a higher opportunity cost of holding inventories, oil inventories may increase, reflecting the decline in global real activity associated with higher U.S. real interest rate

Oil – Double Top Forming Near Key Resistance (Bearish Outlook)WTI Crude Oil is showing signs of a potential double top near the 64.77 resistance zone. Price failed to hold above this strong supply area and has started showing bearish structure on the 2H timeframe.
If price breaks below the neckline around 60.58, it could confirm the double top and open the door for further downside targets:
First support: 58.22
Final major support: 55.46
Expect some short-term bounce before a deeper drop, especially if the rejection from the 64–65 zone holds.
Bias: Bearish
Risk Zone: Above 64.77 invalidates this setup.
Always manage your risk – not financial advice.

USOIL:Sharing of the Latest Trading StrategyAll the trading signals today have resulted in profits!!! Check it!!!👉👉👉
The increase in crude oil production has, in the context of an uncertain demand outlook, sparked concerns about a rise in global supply. After breaking below the 60 mark last week, crude oil continued its downward trend and reached as low as around 55.3. Currently, there is a slight rebound. One can simply find an appropriate position to go short again. Go short on crude oil when it rebounds to around 59.8, and target the price levels of 58 to 57.
Trading Strategy:
sell@59.8-58.5
TP:58-57
The signals in the Signature have brought about continuous profits, and accurate signals are shared every day. Hurry up and click to get them!
👇 👇 👇 Obtain signals👉👉👉

USCRUDEOIL - Potential SellHi Traders,
Here is my view on CMCMARKETS:USCRUDEOIL
BIAS: SELL
Logical Analysis:
From April 2020 to March 2022, oil experienced strong buyer demand, pushing price aggressively from the $7 level up to around $120.
At that point, sellers stepped in, and a temporary agreement between buyers and sellers was established around the $120 zone — a fair value at the time.
Since March 2022, price has been declining — entering a discount phase.
However, the move has not been sharp or aggressive, suggesting sellers are not in a rush.
Importantly, no significant buyer interest has been observed during this entire discounted phase.
🛒 Interpretation:
The “store” (market) offered oil at a huge premium until buyers stopped stepping in at high prices. Since then, the price has been marked down gradually, waiting for a new batch of interested buyers — who haven’t shown up yet but be aware.
Technical Analysis: see chart
Good Luck

usoil:sell@64.5When crude oil rises again and reaches the resistance area, short selling can continue. The upper resistance is 64-65.5.
I will keep sending accurate signals and provide account management services without charging any fees.
Crude oil trading strategy:
usoil sell@64-64.5
tp:62-60

WTI : UPTREND PATTERNYo. Good ? Me too.
1- W Bottom need to break 64.50 for confirmation.
2- H&S pattern inverted is the plan.
3- Target is all pattern is correct : 86 dollars.
4- Weekly show a very good signal
5- Good luck

USOIL:Adapt to the trendTechnical indicators such as moving averages and MACD have a certain degree of lag. The oil price repeatedly crossing the moving average system highlights the current stalemate between bulls and bears and the volatile and oscillating trend. USOIL is influenced by multiple factors, including geopolitical situations, economic data, and OPEC+ policies. Any sudden change may subvert the price trend, causing a certain deviation in technical analysis signals.
At present, with the trend clearly defined, trading in the direction of the trend is the optimal strategy. In the early trading session, we decisively went long at the price of $57. Currently, we are still holding the position, following the trend closely and waiting for the further expansion of the profit margin.
In the future, we will continue to monitor the market changes and update the trading strategies in real time.
I am committed to sharing trading signals every day. Among them, real-time signals will be flexibly pushed according to market dynamics. All the signals sent out last week accurately matched the market trends, helping numerous traders achieve substantial profits. Regardless of your previous investment performance, I believe that with the support of my professional strategies and timely signals, I will surely be able to assist you in breaking through investment bottlenecks and achieving new breakthroughs in the trading field.

USOIL Is Going Up! Buy!
Please, check our technical outlook for USOIL.
Time Frame: 9h
Current Trend: Bullish
Sentiment: Oversold (based on 7-period RSI)
Forecast: Bullish
The price is testing a key support 57.535.
Current market trend & oversold RSI makes me think that buyers will push the price. I will anticipate a bullish movement at least to 61.620 level.
P.S
The term oversold refers to a condition where an asset has traded lower in price and has the potential for a price bounce.
Overbought refers to market scenarios where the instrument is traded considerably higher than its fair value. Overvaluation is caused by market sentiments when there is positive news.
Disclosure: I am part of Trade Nation's Influencer program and receive a monthly fee for using their TradingView charts in my analysis.
Like and subscribe and comment my ideas if you enjoy them!

Oil on high time frame
"Regarding WTI oil, the price trend on high time frames is bearish, especially on the daily chart. After completing its pullback on the 4-hour chart, there are indications of further downside potential.
The market's volatility may be influenced by geopolitical tensions and political factors between Iran and the USA, as well as tariff issues. Despite these fluctuations, candle formations suggest the potential for prices to drop towards the $58 zone."
If you require more assistance or have any specific questions, feel free to ask!

Oil to soon hit below $50.0Please ignore that Asia BOX. Besides that oil is coming further down. but trying to fine tune my entry and exit setup. For me this would be a nice good grade setup cuz of L mapping. I think its got more downside to fall. Hope its not too greedy to set that huge of TP but you never know with commodities and expectations run outside of the reality as bigger the TF more inaccurate you shall be.

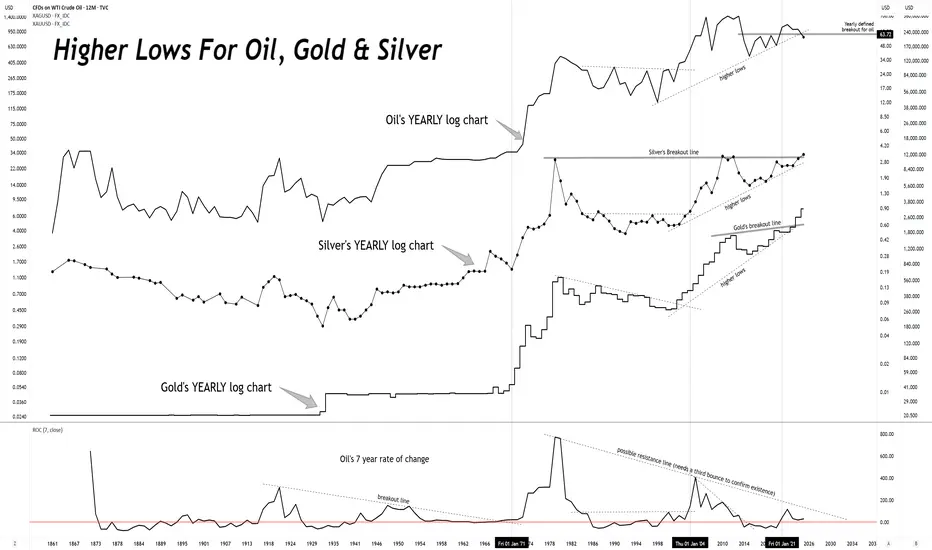
What do silver and oil have in common? Price.Since 1861, silver and crude oil charts have trended together rather well.
So, if you think there is a "cartel" which manipulates the silver, there must also be manipulating crude oil.
Or, the more logical explanation is that capital flows are carving out these price charts.

Shorting XTIUSD Took me 2 years to actually understand trend is your friend and Fib don't lie
Clear short

Crude oil and silver ultimately go where gold goes.Crude oil and silver ultimately go where gold goes.
Oil's YEARLY log chart
Silver's YEARLY log chart
Gold's YEARLY log chart
USOIL BEARISH BIAS RIGHT NOW| SHORT
USOIL SIGNAL
Trade Direction: short
Entry Level: 63.13
Target Level: 61.78
Stop Loss: 64.03
RISK PROFILE
Risk level: medium
Suggested risk: 1%
Timeframe: 1h
Disclosure: I am part of Trade Nation's Influencer program and receive a monthly fee for using their TradingView charts in my analysis.
✅LIKE AND COMMENT MY IDEAS✅
