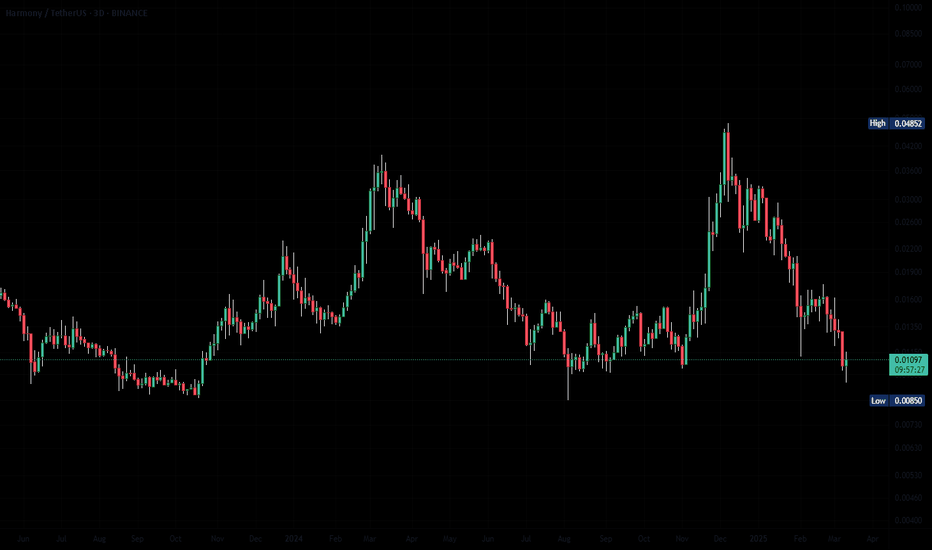
ONE/USDT - Harmoney - 4th Uptrend is just startingBINANCE:ONEUSDT (1W CHART) Technical Analysis Update
ONE is currently trading at $0.01121 and showing overall bullish sentiment
if we look at the past chart, we see ranging market for ONE from past 2 years, the price has hit the accumulation zone and reversing from the zone.
In the past 3 times w
#ONE/USDT#ONE
The price is moving within a descending channel on the 1-hour frame and is expected to continue lower.
We have a trend to stabilize below the 100 moving average once again.
We have a downtrend on the RSI indicator, supporting the upward move with a breakout.
We have a resistance area at the
Harmony (ONE) Breaks Out – Can Bulls Hold Support?Harmony (ONE) has successfully broken out of its descending channel, signaling a potential trend reversal. Now, the key focus is on the retest phase to confirm bullish momentum.
BINANCE:ONEUSDT Daily Update:
Price has moved above the descending trendline, breaking out of the bearish structure.
ONEUSDT, We broke the Pattern and Now ...Hello everyone
According to the , the price movement was made downward triangle and now after the price broke the trendline we expect that the price and power of movement can back to the market and make it up, the target was shown on chart.
if you have any question or need help send us messages
UniversOfSignals | ONE: Key Levels and Market AnalysisIn this analysis, I want to review ONE, the token of the Harmony project. Harmony is one of the layer-1 blockchain networks and is considered one of the older crypto projects.
✨ The token currently holds a market cap of $205 million, ranking 198th on CoinMarketCap.
📅 Daily Timeframe
On the daily t
See all ideas
Summarizing what the indicators are suggesting.
Oscillators
Neutral
SellBuy
Strong sellStrong buy
Strong sellSellNeutralBuyStrong buy
Oscillators
Neutral
SellBuy
Strong sellStrong buy
Strong sellSellNeutralBuyStrong buy
Summary
Neutral
SellBuy
Strong sellStrong buy
Strong sellSellNeutralBuyStrong buy
Summary
Neutral
SellBuy
Strong sellStrong buy
Strong sellSellNeutralBuyStrong buy
Summary
Neutral
SellBuy
Strong sellStrong buy
Strong sellSellNeutralBuyStrong buy
Moving Averages
Neutral
SellBuy
Strong sellStrong buy
Strong sellSellNeutralBuyStrong buy
Moving Averages
Neutral
SellBuy
Strong sellStrong buy
Strong sellSellNeutralBuyStrong buy
Displays a symbol's price movements over previous years to identify recurring trends.


