a long scalp position on OPHi guys,
The reason behind this analysis is market psychology and price action.
When the price was falling towards the line, traders expected to support this level and price broke this level with a strong downtrend. Then there are bears who were thinking now we have a breakout from this level, this is going to play out as a strong supply zone to open short position when it pull backs.
In this situation both buyers and sellers got liquidated and when the price comes back, sellers want to get out of market breakeven and buyers want to add to their position.
Price action wise, this level has some base candles which shows it gathered enough liquidity and it is a price of interest to trade and volume supports this idea.
OPUSDT.P trade ideas

OP - Downside losing steam
We have reached the 100% A-B extension projected in my previous post.
There's no reversal pattern yet, but the downside seems to be losing strength. RSI is beginning to show divergence, and in the 4HR timeframe there's a wedge in formation that could be an ending diagonal.
I'm keeping my eye on a reversal pattern, that could initially target $2 resistance.

$OP/USDTThis is not financial advice.
We can see a break bellow the 0.50% into the 0.236& zone or we can see a reversal to the upside for about 3-4%. What do you think guys ?

OPUSDT sellOP usdt sell lv: 10x
Entry point: 1.5069
Tp: 1.4992
1.4915
1.4804
1.4679
1.45
1.4323
Sl: 1.5748
Margin: 5% of account

Op Looks ready For Another 45 to 50% Bullish Wave Seems Like Getting Ready for Another Bullish Impulse Formed Falling Wedge In h4 tf incase Of breakout expecting 45 to 50% bullish Wave

A possible upward moveHello traders🖐🏿
OP has touched the bottom of all time channel recently with a proper reaction to that level, likewise we can see a major hidden divergence in RSI in daily TF.
From here we expect that price first grow till 2.6$, and then directly go to the 3.7 as a top of the channel.
In addition to all of these, we have some catalyst events in incoming days, such as mainnet upgrade, velodrome, base launch and etc.
I suggest that keep your eyes on OP chart.
Its not a financial advice, its just my idea.
Good luck 👊🏿

OP/USDTOP going back to $2? In the daily time frame,RSI indicator shows RD+
What do you think
like & comment

OPTIMISM OPUSDT Price analysis (Daily)Greetings, esteemed traders of the TradingView community!
Today, we bring to your attention the price of OPUSDT. Since reaching its all-time high (ATH) back in February 2023, the price has experienced a significant decline of approximately 50%.
However, recent price action has caught my attention as OPUSDT has started to break out from a red trendline, which has been forming since the bottoms observed in 2022. This breakout holds potential for a continuation in the price's downward trajectory.
Furthermore, a triangle formation that developed between February and April of 2023. The triangle pattern was broken to the downside, and the target of this pattern aligns closely with a previous resistance zone around the range of 1.3-1.4 USD.
Considering the oversold conditions indicated by both the MACD and RSI indicators, it becomes quite likely that we may witness a rebound in this aforementioned price zone. This presents an intriguing opportunity for traders to explore.
Thank you for your attention and support. Feel free to explore our other articles, follow our page for more updates, and kindly share your valuable feedback on this idea. Happy trading!

BullishThis currency has completed its Gartley pattern and according to the daily positive divergence and the support range it has, it can grow up to the specified levels. In my opinion, the best purchase price is 1.28

OP (Y23.P2.Video1).Macro and possible scenariosHi Traders,
We are still bullish with BTC and have 2 bullish scenarios and hence the likes of ALTs are likely to find a support level soon and we are think the following for #OP based on fibonacci levels and measured moves.
Hope you enjoy and benefit from this video.
All the best,
S.SAri

OPUSDT +50% moveI predicted OPUSDT coin an a 80% market move for not more than a two months I trade futures so guess what i earned a lot from this coin.
* This coin follows the market conditions and It's one of the top coins that i like to trade!
!!! TRADE IT ON YOUR OWN RISK!!!

OPUSDT COIN LONG IDEAOPUSDT coin is in a downtrend of 50%. I hope this will be the perfect zone to buy I'm close to sure that we need to buy right there because we have 4 reasons to enter this trade. I hope we get this trade.

OP USDT Mid Term Idea 🚀🚀🚀 Descending Wedge Pattern
We have 2 targets in mind, 1,6335$ (tp1 %21), 1,9575$ (tp2 %45)
This analysis is for mid-term buying.
This is not financial advice ( DYOR )
Good luck


OP/USD - Long Scalp OpportunityOP/USD - Bullish Harmonic
Long scalp - Targets shown on Chart.
Good luck!

OPUSDT.1DHello dear friends,
*Mars Signals Team wishes you high profits*
This is a daily time frame analysis for OPUSDT.1D
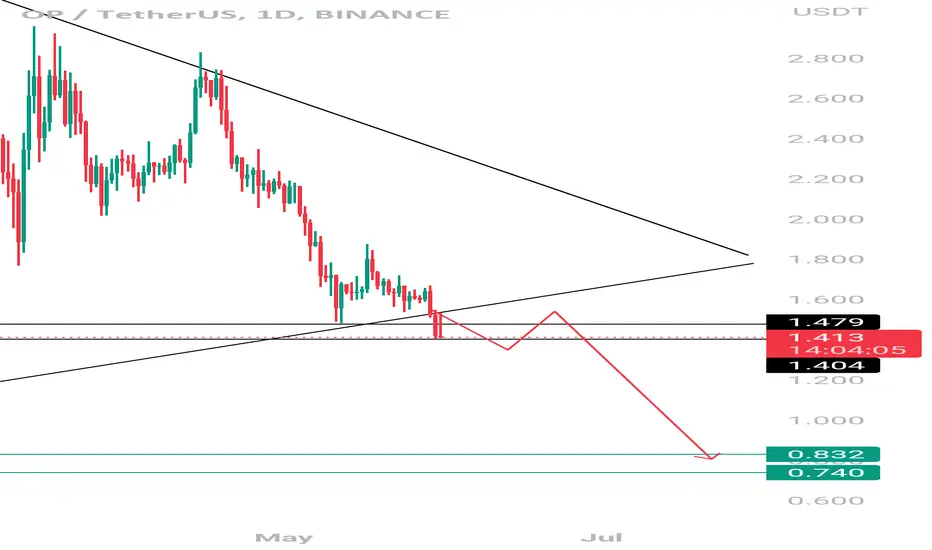
We are in the daily time frame. As you can see, the price is moving towards our support line and we expect it to support the price and move towards our first resistance line. But if it cannot stabilize above the line and penetrates below the support line, we expect a fall to the second support line.
Warning: This is just a suggestion and we do not guarantee profits. We advise you to analyze the chart before opening any positions.
Take care

Op another breakdown Opusdt
As we predicted in previous analysis op rekt
This time I am expecting another leg down
Op needs to bounce back from this zone otherwise another 20-30% drop expected
Dyor
Retest for ShortOn daily TF
- Breakdown Ascending Trendline
- High Volume + Big Red Candle
My point, OP will down to 1.15 and consolidation around that level
Wait and see

OP ANALYSIS (12H)Hi, dear traders. how are you ? Today we have a viewpoint to BUY/LONG the OP symbol.
For risk management, please don't forget stop loss and capital management
When we reach the first target, save some profit and then change the stop to entry
Comment if you have any questions
Thank You

OPUSDTHello Traders, this is outlook that i think might be work. All Entry, Stop Loss, and Take Profit its already showed up. All trade it is on yourself. DYOR

OPUSDTHello Traders, this is outlook that i think might be work. All Entry, Stop Loss, and Take Profit its already showed up. All trade it is on yourself. DYOR

OPUSDTHello Traders, this is outlook that i think might be work. All Entry, Stop Loss, and Take Profit its already showed up. All trade it is on yourself. DYOR

OP (Y23.P2.Video1) The story continues. The next entryHi traders,
This chart is not the most bullish structure of recent as we approach the most critical level for OP to be macro bullish. As long as BTC doesn't drop hard and with a slight possibility to continue up from where we started 2 days ago, then OP has a chance as well.
We look at the key levels and why they are important.
Please give me a like and share,
Regards,
S.SAri
