ORCA/USDTKey Level Zone: 2.560 - 2.700
HMT v8.1 detected. The setup looks promising, supported by a previous upward/downward trend with increasing volume and momentum, presenting an excellent reward-to-risk opportunity.
HMT (High Momentum Trending):
HMT is based on trend, momentum, volume, and market struc

ORCA Buy/Long Setup (4H)The ORCA structure is bullish and shows strong bullish momentum. Therefore, we can look for buy/long positions at the origins of the moves.
We have identified two entry points on the chart, where we will be looking for buy/long setups.
Target levels are marked on the chart.
A daily candle closing

Still Have a Chance in This Sideways MarketPrice is currently moving within a wide sideways range between 2.670 – 4.000, which is roughly a 50% price fluctuation—still a tradable range if we can identify key reversal zones and market structure.
From the structure, we can see that BINANCE:ORCAUSDT has broken the previous high and formed a

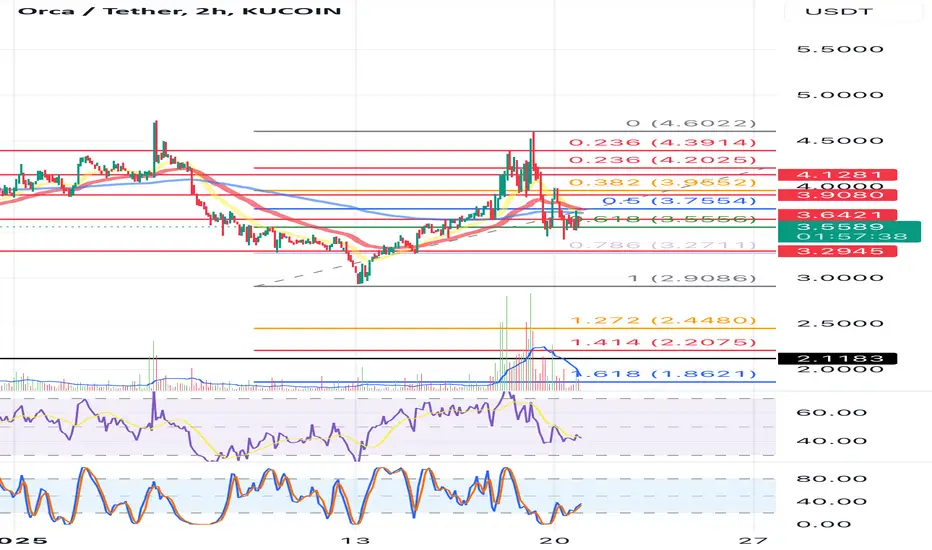
ORCA/USDT – Futures Setup: Potential Short OpportunityORCA is currently testing a resistance zone at 2.940 USDT, an area where selling pressure has historically emerged. Price action indicates a potential rejection, setting up a possible short trade targeting lower support levels.
📌 Futures Trading Levels:
Entry Zone: 2.920 - 2.940 – short positions

ORCAUSDT CHART ANALYSİS - EDUCATIONAL POSTConclusion
The NFT market is developing extremely fast, and the blockchain infrastructure has undergone significant changes over the past few years. However, today, there are still many questions about how the NFT market can function and in which areas non-fungible tokens can be used.
For example

ORCAUSDT – First Support at the Blue Box!🐋 ORCAUSDT – First Support at the Blue Box! 🚀
“Patience is key—the blue box is our first support area, but confirmation is everything!”
🔥 Key Insights:
✅ Blue Box = First Support Zone – A reaction here could be a strong buy signal.
✅ No Blind Entries! – We wait for CDV, LTF breakouts & volume con

ORCAUSDT(ORCA) Updated till 21-03-25ORCAUSDT(ORCA) Daily timeframe range. we can see a massive pump today, peoples filled their bags. alltho the pump retraced if PA can stay above 2.578 it can pull back to 4.433. local support still at 1.446.

ORCA/USDT – Final Leg Up Before a Potential Reversal ORCA/USDT – Final Leg Up Before a Potential Reversal
1. Price action suggests ORCA is making one last upward move before a possible trend reversal.
2. Recent momentum indicates buying strength, but selling pressure could soon dominate.
3. A key resistance zone is approaching, which might trig

ORCAwhoever understands what is going into the market, this is an example of whats going on.
most of the projects are going rug, slow rug, exchanges, devs, whales all are manipulating the market.
if you sit and analyze binance projects, 85-90% are sinking, in a very strange way, selling slowly and ma

See all ideas
Summarizing what the indicators are suggesting.
Oscillators
Neutral
SellBuy
Strong sellStrong buy
Strong sellSellNeutralBuyStrong buy
Oscillators
Neutral
SellBuy
Strong sellStrong buy
Strong sellSellNeutralBuyStrong buy
Summary
Neutral
SellBuy
Strong sellStrong buy
Strong sellSellNeutralBuyStrong buy
Summary
Neutral
SellBuy
Strong sellStrong buy
Strong sellSellNeutralBuyStrong buy
Summary
Neutral
SellBuy
Strong sellStrong buy
Strong sellSellNeutralBuyStrong buy
Moving Averages
Neutral
SellBuy
Strong sellStrong buy
Strong sellSellNeutralBuyStrong buy
Moving Averages
Neutral
SellBuy
Strong sellStrong buy
Strong sellSellNeutralBuyStrong buy
Displays a symbol's price movements over previous years to identify recurring trends.