Others long term.The most likely scenario in my opinion.
* The purpose of my graphic drawings is purely educational.
* What i write here is not an investment advice. Please do your own research before investing in any asset.
* Never take my personal opinions as investment advice, you may lose your money.
OTHERS trade ideas

Altcoins Market Cap: We on the Verge of a 5T Exposion!Hey crypto traders! Let’s dive into this monthly chart of the Altcoins Market Cap. You won’t believe what’s brewing!
We’re currently approaching a critical channel support at 200B, a level that might act as a springboard for massive rally — check out the jumps from channel support in 2019 and 2023! Each time the market cap hit this support, it skyrocketed, and now we’re at that pivotal moment again.
The chart projects a jaw-dropping target of $5T within the next 24 months if history repeats itself!
The price action shows we’re testing the lower boundary of this ascending channel, with the market cap sitting around 239.65B. A bounce here could send altcoins on a parabolic run, potentially hitting 5T by mid-2026. But if support fails, we might see a dip toward 100B — let’s keep an eye out!
Key Levels to Watch:
Support: 175B (channel support)
Resistance: 1.55T, 5T (projected target)
Breakdown Risk: 100B
Are altcoins about to explode to 5T, or will we see a deeper correction? Drop your thoughts below!
PS take a look at others vs. btc price action here:

others alts#Altcoins Index OTHERS is exposed to healthy corrections but ready for the next bullish leg from MA25 support!

The Worst Is Over – Bullish May and June AheadAfter months of uncertainty, volatility, and fear-driven sell-offs, the altcoin market is finally showing signs that the bottom may be in.
The Market Cipher indicator are flashing early bullish signals, with trigger waves beginning to play out. While we still have key resistance levels to clear, particularly the 200-day and 200-week SMAs. All signs point to a market that’s gearing up for a strong move to the upside.
Now, if Trump could just chill with the tariff war talk, we might even get some macro tailwinds to support the rally.

OTHERS/BTCUSD: The Ultimate Indicator for Altcoin SeasonsHey TradingView community! I’ve been analyzing the OTHERS/BTCUSD metric, and it’s painting an exciting picture for altcoin traders. This chart might just be the key to timing the next big altcoin rally — let’s break it down!
What is OTHERS/BTCUSD?
This metric calculates the total altcoin market cap (excluding Bitcoin) divided by BTC/USD. It shows how altcoins perform relative to Bitcoin.
High Metric : Altcoins are outperforming Bitcoin — think altcoin season!
Low Metric : Bitcoin dominance takes over, and altcoins take a backseat.
Historical Patterns: Falling Wedges Stealing the Show
The OTHERS/BTC Weekly chart reveals three Falling Wedge patterns, a bullish setup that’s historically preceded massive altcoin bull runs:
1st Altseason (2017-2018) : A Falling Wedge formed in 2016 (prior pink zone). The breakout unleashed a legendary altcoin rally — remember Ethereum and Ripple going parabolic?!
2nd Altseason (2020-2022) : Another wedge in 2018-2019 (blue zone) led to the 2021 altcoin boom, with projects like Solana and DeFi tokens soaring as the metric hit 10M.
3rd Falling Wedge (2022-Now) : Since 2022, a new wedge is forming (green zone), resurfacing the setups that sparked the last two altseasons.
Current Setup: A Critical Support Zone
As of April 27, 2025, the metric is approaching a key support zone of 2M-1.5M (where the altcoin market cap equals 1.5M to 2M Bitcoins).
Historical Significance : This level has been a launchpad in the past — both in 2016 and 2019, it marked the bottom before altcoins reversed and surged.
What’s Next : If this wedge breaks out, the metric could climb to 7M, 9M, or even 11.5M by 2025-2027. That could mean 5-10x gains from bottom for altcoins, depending on the pair!
A sinusoidal wave at the bottom of the chart — it reflect market sentiment cycles, with troughs (like now) often preceding altcoin season greed phases.
Why This Metric Matters
OTHERS/BTCUSD captures the flow of capital in crypto:
Bitcoin often leads bull cycles, pulling in capital first (metric drops).
When BTC’s rally cools, investors chase higher returns in altcoins (metric rises).
The Falling Wedges highlight this cycle — consolidation during Bitcoin dominance, followed by breakouts when altcoins take the spotlight.
Trading Takeaway
Monitor the 2M-1.5M Zone : A breakout here could be your green light to stack altcoins.
Cross-Check Bitcoin Dominance : A drop in BTC.D (Bitcoin Dominance) would confirm capital flowing into altcoins.
Pick Strong Projects : Look for altcoins with solid fundamentals — layer-1s, DeFi, or AI tokens could lead the charge.
What’s your take, TradingView fam? Are you gearing up for the next altseason?
Drop your favorite altcoin picks or charts in the comments — I’d love to hear your thoughts!

Alt season won't be too far!Based on common indicators, "Others" chart shows an obvious trend and pattern which, overall, confirms the high possibility of a new Alt season.

Altseason coming very soon...Alt seasone is coming very quickly. Never know when it hits.... Just wait and do Nothing :)

$OTHERSAccumulation is looking good. I am looking for a capitulation event before the massive run. I don't think the fear is over, we had too much greed way too fast on every bounce since the tariff news dropped. People are desperate for the bullrun. Last shakeout.
Buy your favorite Alt when CRYPTOCAP:OTHERS total MC is 150B and under.

$OTHERS appears to have found its bottom — a breakout could be n🚀 CRYPTOCAP:OTHERS (altcoins excluding the top 10) may have bottomed out — and could be ready for takeoff!
I’ve been closely tracking CRYPTOCAP:OTHERS , and the chart clearly shows a consistent downtrend since the mini altseason back in December 2024.
Now, it looks like the downtrend has fully played out, with a potential bottom forming around April 7th (see the yellow arrow on the chart).
This setup mirrors what we saw before CRYPTOCAP:OTHERS when we got a pump in dec 2024. With price action now bouncing from a key support zone, it’s possible we’re on the edge of another mini altseason.
The green lines are showing the area of support and resistance. A large support is at the current level likely to offer a bounce in the short term.
📈 Key Signs:
Fully retraced move since the last rally
Support holding firmly
Resistance retest incoming
This could be the early signal many are waiting for.
🧠 DYOR — as always, nothing is guaranteed, but the signs are promising.

Altseason? Not yet — but the real move is coming... soon.As shown in the chart, the weekly MACD reset isn’t complete yet. A similar setup happened in September 2024 — we got a fake pump that fooled many, while the real breakout started in December 2024.
🔍 Why does this happen?
Impatient whales — often close to the “crypto president” — start buying early. Using influencers and media hype, they push the "New ATH" narrative and lure in retail. But this early FOMO creates a massive bearish divergence — the RSI hasn’t reset yet, and the market isn't ready.
📉 The result?
A painful 6-month correction that punishes impatience. The market always reverts to math — and math doesn’t lie.
You can’t fake momentum forever — no matter how much money you throw at it.
💡 My forecast remains unchanged:
Once the MACD weekly crossover happens, the real pump begins — no ETF, no Saylor needed. The market moves on its own, as it always has.
📊 Check the chart. Read the signals. Trust the data.
#Bitcoin #BTC #CryptoTrading #CryptoWhales #MACD #TechnicalAnalysis #BearishDivergence #Altseason #DYOR

A new correction is possible.I think the up and down waves are pretty clear.
* The purpose of my graphic drawings is purely educational.
* What i write here is not an investment advice. Please do your own research before investing in any asset.
* Never take my personal opinions as investment advice, you may lose your money.

Altcoins vs Nvidia - What happens now?How does this chart not make you bullish on altcoins?
It happened twice before. Same pattern is happening again.
We are getting ready for an altcoin season!
I'd be surprised we get a 10x like last time. I'd be happy with 5x. Diminishing returns, right?

Altcoin Market (OTHERS) Cycle Analysis: To the Moon !Let’s take a closer look at the previous bull cycle of the Others (Altcoin Market Cap excluding BTC & ETH) chart.
Before the major upward move, the market declined for months, eventually finding strong support around the $170B level.
After forming a higher low and a clear change of character (CHOCH), the market entered a sustained bullish phase. For 124 consecutive days, we witnessed a strong altcoin rally.
As of now, price action appears to be mirroring that same structure — but with a potential to push even higher than the previous ATH.
In this scenario, the target stands around the $470B level. As long as OTHERS holds above the $170B support, the altcoin market remains in recovery mode, and further upside is very much on the table.
— Thanks for reading.

$OTHERS is the correction over? All is in the Chart!Check the yellow arrows and lines— CRYPTOCAP:OTHERS (all altcoins excluding the top 10) is following a correction pattern similar to CRYPTOCAP:BTC and the $SPX500.
📉 On the 1W timeframe, the MACD is overbought and currently in the middle of a correction. This typically signals a bounce in the coming weeks.
🕰️ If we compare this to the previous cycle, it appears we're at the early stage of what could become an altseason. Back then, it took around 10 weeks after this point to see the real breakout.
🗓️ Based on that, I forecast:
May: first major pump
July–August: consolidation
September–October: final leg up
Despite recent announcements from Trump, the 1W chart has not significantly changed—everything is progressing as expected.
📊 You can verify this macro alignment with my other analyses:
🔗 SPX500 (trendline shows bottom around Sept 2025 at 4700):
🔗 CRYPTOCAP:TOTAL (crypto market macro view):
🔗 CRYPTOCAP:BTC (warning posted on Feb 5, 2025):
📈 Everything is aligning—traditional markets, Bitcoin, and altcoins.

The 4 Crypto Market Cap charts and SMA's comparedTop Left TOTAL CRYPTO MARKET CAP
Top Right TOTAL 2 CRYPTO MARKET CAP ( Minus Bitcoin )
Bottom Left TOTAL 3 CRYPTO MARKET CAP ( Minus BTC and ETH )
Bottom Right OTHERS CRYPTO MARKET CAP ( Top 125 coins Minus Top 10 by dominance )
50 SMA RED
100 SMA BLUE
128 SMA GREEN
TOTAL Cap is the ONLY one that has broken above the 2021 ATH and has subsequently dropped back under but is still "touching the line" with a Wick up from the current candle.
It can also be seen how it is only the TOTAL chart that has remained easily above the 50 SMA since late 2023. The toer charts can be seen to have needed to bounce of it in 2024
The TOTAL 2 & 3 charts have very similar Candle moves and 50 SMA use.
To me, this is telling us about the Higher Cap ALT coins.
The fact that both TOTAL 2 ( Minus BTC ) and TOTAL 3 ( Minus BTC and ETH ) are similar shows me the little impact of ETH on price rise. These Charts are held up by the Higher ALT coins like SOL, INJ, SUI, XCN, HBAR to name a few. Most of these are still less than 100% gains over the last 12 months.
But what the slight Difference there is between the two charts does show us that ETH is a burden. It is dragging the TOTAL 2 chart down lwoer than the TOTAL 3 and that difference, though small on a monthly chart, is VERY SIGNIFICANT
OTHERS tells a huge story of how the Mid to Lower Caps are paying the price of Bitcoins adoption by Corporations and the fact that, as a result of these Corporations HOLDING, Bitcoin Dominance remaining High. The money that has once been used to Feed the ALT Market is static.
OTHERS is also the only chart that has fallen below its own 50SMA
That is not Bullish and very clearly shows how the Crypto Market has now matured and the absolute Tidal wave of New, worthless, useless ALT coins are failing.
This does not mean that will continue but I am inclined to believe that while we have such uncertainty in the world, the utter risk of investing in something with no use or history and security does not appeal to many.
To many extents, this could be seen as the beginning of the " Dot Com" Bubble burst for Crypto, where the best Coins / Projects are adopted and the rest, well, fall aside......
We shall see

OTHERS Market Cap Monthly Candle close colours tells a Story
OTHERS - Top 125 coins MINUS top 10 by Market dominance.
OR The MID to LOW caps ALT coins.
The closeness of these Candles close colours tells a Story to me
There are only two months since 2017, where the count is not 6 to 5
Febusary has the biggest difference with a majority GREEN at 8 - 3
But that had little effect this cycle with the last 5 Months ( including this april) being RED
There is only ONE occasion that has happened before, and then went on to be 9 consecutive RED months and that was after the height of the ALT Season in 2017
The only positive I can offer here is that, After the RED March, April was Green on 3 occasions.
What we can take away from this is that the MID to LOW cap ALTS are NOT seasonal, it is a Hit an dMiss chance of taking the right coin at the right time and trading
You will also notice how the Actual Market Cap is currently LOWER than the height of the 2021
Infact, this is true for ALL the Market Caps EXCEPT TOTAL
This Very Clearly shows us all that it is BITCOIN that holds the market up and it is that Dominance that has Hurt ther ALTS so much.
Will this change ?

9 month liquid venture betsBe Greedy When Others Are Fear Full - Buffet
-- First post. Take it with some salt. --
Nothing in this post is investment advice. It’s barely even coherent thought. I own random coins, have exposure to stuff I forget about, and might be wildly conflicted without realizing it. Assume I’m biased, assume I’m losing money, and most importantly: assume I will sell everything without telling you the second I feel like it. Always do your own research, or better yet — stop reading, it will likely waste your time anyways.
Key takes:
Macro fear is fully priced — dislocations create asymmetric upside opportunities.
Liquidity conditions remain supportive — policy catalysts can trigger sharp repricing.
Infrastructure plays in cross-chain messaging and modular blockchains are left for dead but inevitable.
Cultural assets represent a new frontier for community-driven value creation.
Global macro markets have been crushed. Trade wars and peak recession fears have fully reset positioning. Equities crashed hard, bounced even harder — but sentiment is still dead. To me, this is not the moment to turn bearish. This is exactly the moment to start looking the other way.
The S&P 500 dipped 21%. Nasdaq dipped 25%. Bitcoin dipped 31%. Others (crypto outside of top10) dipped as much as 61%. Maximum fear is priced in. Recession seems consensus.
But behind the scenes?
U.S.–China trade dialogue has resumed.
Policymakers globally are preparing stimulus.
The Fed pivot may be closer than markets expect.
When positioning is light, sentiment is exhausted, and policy shifts — markets don’t wait. They rip.
It’s not about what today’s headlines say — it’s about what the next headlines will be.
And it’s not about whether outcomes are positive or negative — it’s about whether the current market psychology is underestimating or overestimating what’s coming.
Tariff expectation → too bearish
Trump chaos → Overestimated
Skilled technocratic cabinet → Underrated
Rate cuts → Expectations too low
Deregulation impact → Underestimated
Lower taxes → Invisible but real
CrossBorder Capital’s Global Liquidity Index (GLI) seems to confirm it: liquidity isn’t done yet, we have approx 9 months left — and risk assets tend to perform best at the end of the liquidity cycle. Given that — and considering the main viral narratives dominating the crypto headlines for months now:
VC's scams don't work anymore
Oversaturation of projects, their will never be enough demand.
These coins will never justify there revenue
Frequent and poorly managed token unlocks will crush the prices
Pump.fun destroyed retail demand
My response would be:
At some point things will be priced in and prices trade below there value. When that happens — even the few holders still up on their position won’t be willing to sell anymore. There’s always that moment — nobody expects it — where supply dries up, the market reverses, and sentiment is (as always) slow to catch up.
Just before everyone sees it, a great leap of faith is needed.
Right now, three major themes are left for dead — DFV:
1. Cross-chain messaging (deep tech)
USDT0 Tether, WBTC, Berachain, Monad, Telegram, Ethena, Aptos, Movement, PayPal, Wyoming, Eigenlayer, Pumpfun, HyperEVM... and I’ve likely missed many names that are benefiting from the market leader crosschain infrastructure— this is still just the beginning. Demand for omnichain communication is growing fast and LayerZero is the main protocol. Billions transferred cross-chain for cents. Study OFT.
COINBASE:ZROUSD Great team backed by world-class investors, already in use, and moving fast.
2. Modular blockchain architecture (deep tech)
Market leader Celestia soon offers what Ethereum’s roadmap hopes to deliver years from now: scalable data availability + ZK-proof compatibility.
COINBASE:TIAUSD The space is converging. The architecture is maturing.
3. Movement Coins / Neo-religions
After the Pumpfun craze, the majority will be hunting for something similar but different.
Memecoins like SPX6900 transcend speculation, evolving into cultural movements or "neo-religions." They channel financial nihilism and the last hope for retail into community-driven protests against traditional systems — offering hope and belonging.
CRYPTO:SPX6USD (special thanks to my bro for sharing this one)
If one is positioning The radical portfolio strategy for these liquid venture bets could look something like:
70% Deep Tech / 30% Movement Coins.
-
This content is for informational purposes only and does not constitute investment advice, an offer, or a solicitation to buy or sell any financial instrument. The views expressed are those of the author and are subject to change without notice. Any investment strategies discussed herein are high-risk, speculative in nature, and are not suitable for any investors. Always conduct your own research and consult with a licensed financial advisor before making investment decisions. Past performance is not indicative of future results.

Breakdown Looming in Altcoin Market Cap? Weekly Chart AnalysisThe Crypto Total Market Cap Excluding Top 10 is currently flashing a textbook Head and Shoulders (H&S) reversal pattern on the weekly timeframe — and if confirmed, it could signal a substantial decline in the altcoin sector's market value.
Let’s dive into the technical breakdown and market psychology behind this setup.
🧠 The Pattern Breakdown: Head & Shoulders
Left Shoulder (L): Formed in early 2024 after a sharp rally met resistance just below $320B, leading to a correction.
Head (H): Marked a peak in Q1 2025 above $400B — but failed to hold, rejecting at a key liquidity zone and forming a long wick.
Right Shoulder (R): Projected in the current price structure. A potential retracement to the $320B region could form this, completing the right shoulder before the breakdown.
Neckline (N): Currently being tested at the $200B mark — this is the make-or-break level. A confirmed weekly close below this line would activate the bearish pattern.
📉 Target Projection & Technical Implications
If the Head & Shoulders structure plays out:
Breakdown below Neckline (~$200B) would likely initiate a measured move towards $80B–$100B, completing the pattern.
This aligns with a major liquidity void seen from mid-2023, where price previously moved rapidly — meaning there’s little structural support in that zone.
🔍 Confluence Factors Supporting Bearish Outlook:
Liquidity Void: Below the neckline, there’s a high-risk vacuum where price may drop quickly.
Volume Decline on Rallies: Bullish impulses are weakening, suggesting distribution rather than accumulation.
Lower High Structure: Overall macro structure is shifting from bullish to neutral/bearish.
Failed Reclaim of Key Resistance (~$360B): Shows weakness in altcoin market interest.
🧠 Trading Mindset & Strategy Ideas:
For savvy traders and institutions, this is a high-probability short bias setup to monitor. While retests of the neckline often offer premium short entries, managing risk here is essential.
Scenarios to Watch:
✅ Bearish Confirmation: Weekly candle closes below neckline with increasing volume.
🔁 Bull Trap Potential: Price briefly reclaims $240B–$260B then rejects hard — classic fakeout behavior.
🛡️ Invalidation: A breakout above the “Head” (~$420B) level invalidates the bearish setup and resumes bullish structure.
🚨 Final Words: Altseason or Alt-geddon?
The altcoin space is currently sitting on the edge of a cliff. This isn’t just another dip — this is a potential macro reversal pattern forming across months of price action. If you’re holding heavy bags of alts, it might be time to hedge or scale out while monitoring the neckline area closely.
For traders, this is where capital preservation meets calculated aggression.
✍️ Written by a chart analyst who sees opportunity in both sides of the market.

The Most Overlooked Setup in Trading: Your Own Decision ProcessTrading psychology at its finest — where the real edge begins.
Over time, I’ve realized that most traders obsess over systems, setups, and signals... but very few ever stop to ask: “How do I actually make decisions?”🧩
The truth is — every trade I take is a result of an internal process. Not just some rule from a strategy, but a sequence of thoughts, comparisons, and feelings I go through (sometimes without even realizing it). And when I mapped it out, it changed the way I approached the market. 🔄
Here’s what I found:
1.There’s always a trigger.
Sometimes it’s a chart pattern. Other times, it’s a shift in sentiment or an alert I’ve set. But that moment when I *start* to consider entering — that’s the spark. Recognizing that moment is the first step. ⚡
2.Then comes the operation phase.
That’s when I begin scanning. I look for setups, patterns, confluences — not just at face value, but through the lens of my experience. I start running mental “what-if” simulations, visualizing what the trade could become. 🔍
3.The test phase is critical.
This is where I mentally compare the current opportunity with past winners or losers. Does it “look right”? Does it “feel like” a good trade? That moment where a setup clicks isn’t just about indicators — it’s about internal alignment. 🧠
4.Exit isn’t just a price level — it’s a decision threshold.
Knowing when to act (or not) often comes down to a shift in internal state. For me, it’s usually a combination of visual confirmation + a gut signal. When both align, I act. 🎯
📌 Why does this matter?
Because most failed trades aren’t just “bad signals” — they’re *poorly made decisions*. If I don’t understand my internal process, I’m flying blind. But when I do, I can refine it, track it, and improve it.
If you’ve never mapped out your decision-making strategy, do it. You’ll learn more about your trading than any indicator could ever teach you. 💡
👉 Keep following me for decision-making insights and real trading psychology facts — the stuff that actually moves the needle.

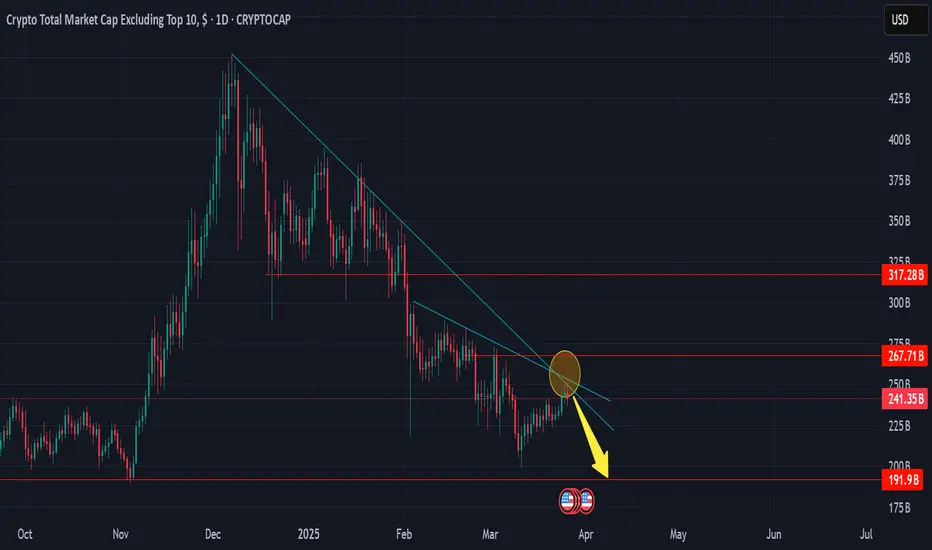
Altcoin Still StruggleOTHERS reject trendline from early December 2024 and early February 2025
simple, if we cant break trendline and go above 270, its so over 190 or lower incoming

ALTS will rise for a month, recover 200-300%There’s good news and bad news.
The good news is that altcoins are likely to bounce back to the 0.5 Fibonacci level—just like they have in every past bear market.
The bad news? We’re in for a year-long bear market that could last until the end of the year.
I’m expecting a rebound into early May.

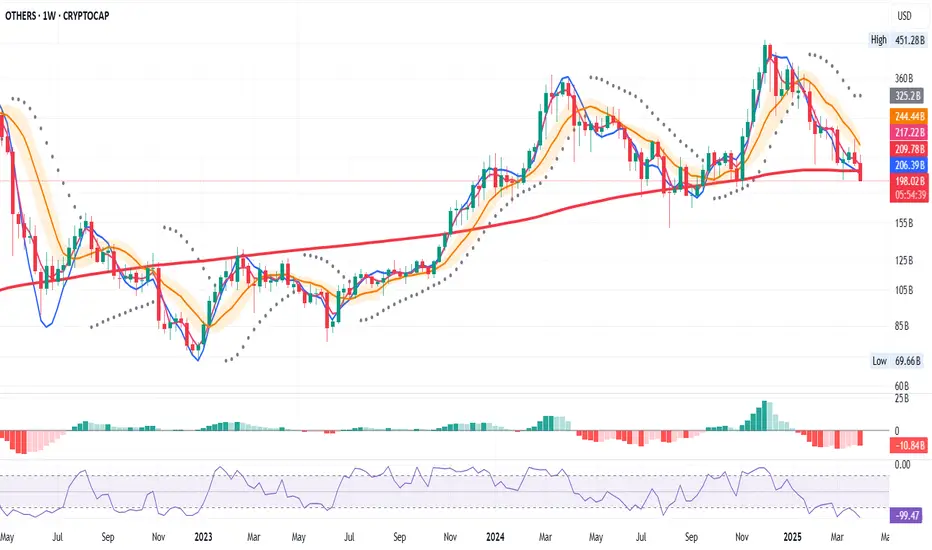
OTHERS Weekly – Testing Critical Support 200MA
The altcoin market is in a fragile state. On the weekly, OTHERS is about to close below the 200 MA—a key structural level. Meanwhile, the system remains fully bearish:
- LR < SMA < BB center
- PSAR above price
- No setup, no trade
This is where discipline saves capital. It’s easy to feel urgency when the chart looks rough, but reacting emotionally only leads to losses. Even now, I remind myself: structure first, sentiment second. When rules align, I’ll act. Until then, I protect capital, not pride.
Most of trading is waiting. The rest is having the mindset to know why.