OTHERS bounce with possible rejection 320B+Very simple pattern anon. Bounce from pitchfork on the perfect time.
Can start shorting around 321B.
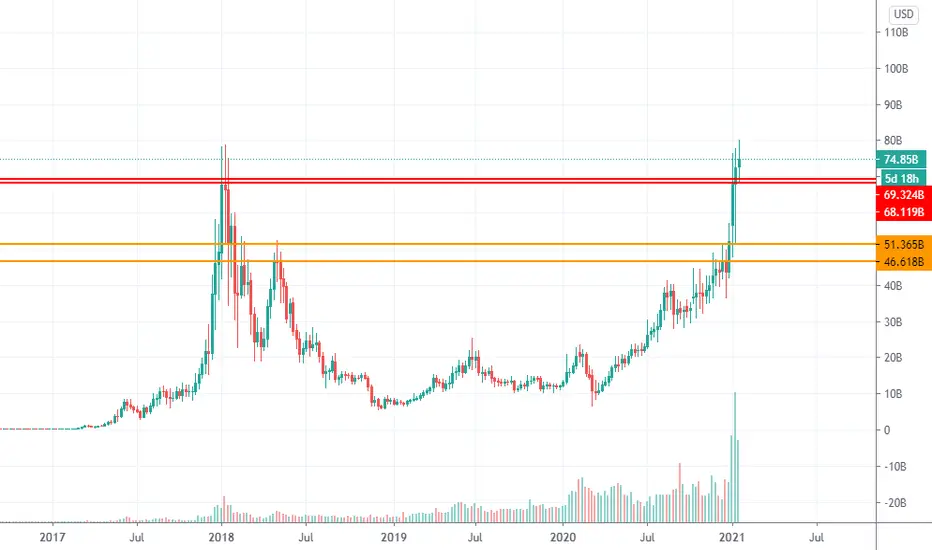
wen moon?
OTHERS trade ideas

When relief bounce?Bounce from pitchfork wen?
wen we moon? wen relief?
wen pump?
I check price, price bad. I check price, price up?

Currencies, #other bitc bitcoin Now I put this scenario before you and God is higher and I know before us a whole year, God willing, on November 28 or December 5, 2022, I will bid farewell to the market
Conditional on not closing under the channel

TOTALMCAP Analysis - All you need Comparison zones in green
Resistance turned support zone in blue
Support areas in yellow
Heading for a June 2022 top!
Falling wedges are a very apparent bullish pattern also


OTHERS MCAP, Emphasis on June 2022Many of my charts are suggesting a June 2022 end to the bull market
Similar price points can be seen at .618 and 1.618
The curved pattern is pretty cool to observe, I wonder if it will continue further upwards
We are currently in the green circle, a pullback after a bull run, preparing us for the bigger second phase bull run, which is plotted after the green circle
This chart above also suggest June 2022


Total Market Cap Analysis -BTC and ALTS Short for ALTS Total market capitalization is slowly trending down, capital is going out of the market.
Levels to watch for total alt coins market if we break $185B there's a possibility that August will be a red month (Shorting is still majority of my trades spotting on the LH )
But we cannot take away the possibility of market reversal in the short term as the market will always create its LH.
If we break down below $146 B for the alts MC things might get worse there or we see supply build up.
Overall trend we are still into a long downtrend.
Is this the time to bag ? Not yet .

An example of an MA kissAnother example of an MA kiss
was requested on the last chart for (Pundi X)
When the two MA's briefly touch horizontally
This is OTHERS MCap which is linked

Market Cap OTHERSVery long term view
we are currently in a bull phase
looking to sell possible in January - June 2022
Before predicted bear market initiation

OTHERS Move Cooking, AltcoinsA move is cooking for the OTHERS market cap, which includes all altcoins bar the top 10
It looks really bullish with the ascending scallop

Moving Average Analysis - MCAPFrom these charts we can draw the conclusion that the chart 'OTHERS' is developing the separated three moving averages that can be seen on TOTAL.
A moving average pattern like this can last from months to years.
We can also draw the conclusion that Bitcoin is not completely connected to alt-coins and there is a disconnect between the two. Also we may see OTHERS excel above TOTAL, as it is clear that the chart is at a younger stage of development relative to the moving average structure.
Interested to see how this plays out. Remember, Diamond hands!!

Crypto market is overbought based on momentumLooks like the market is overbought like it has three times in the past.
This red line is the top of the momentum indicator. This is a major correction level because the market is overbought.
The blue waves are momentum.


The best indicator for Bear Vs BullThe indicator is called Gaussian Channel
It is great and I thought I would share,
Clearly shows bear runs and bull runs
We are early, in the beginning of a bull run, if history holds any value this could push massively to the upside
Message me if you would like a link to the indicator :D


Alt Coin / Total Crypto Market Cap Growth PotentialThis was based on an idea proposed by Nicholas Merten in a recent tweet. The diagonal line serves as the median point on a sine wave pattern we see emerging in the growth of market cap over the entire crytpo-currency space. The range projected for the next cycle as we approach crossing above the median. If we expect a similar curve, and use even a small fraction of the previous growth cycle, the gains still appear to be quite large.

time to load some more SHITCOINs !!!i warned you about altseason 2 month ago ( check related ideas ) now others crypto market cap broke ATH and retested it ! what does it mean ? you remember what happened when bitcoin did the same ? lets go