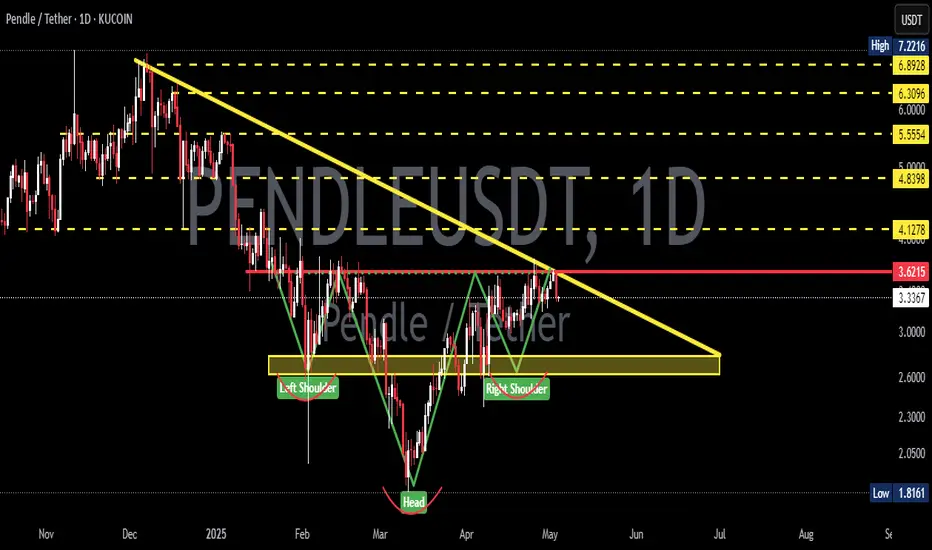
PENDLEUSDT 2D AnalysisPENDLE ~ 2D Analysis
#PENDLE Buy when re -testing this support block or buy after successfully penetrating this resistant line with a short -term target of at least 10%+.
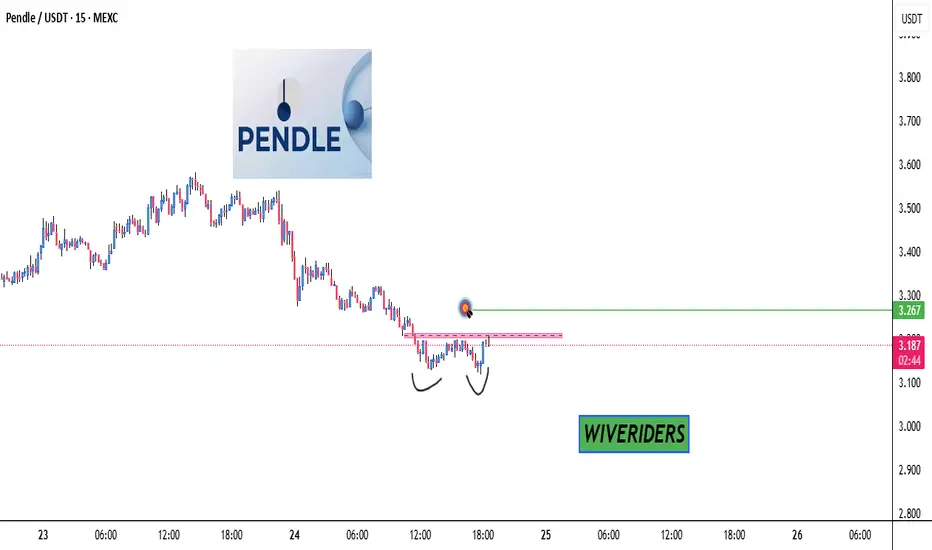
Double Bottom Breakout Watch! 📈 CRYPTOCAP:PENDLE - Double Bottom Breakout Watch! 👀
⏳ On the lower timeframe, CRYPTOCAP:PENDLE has formed a double bottom pattern.
🔴 Confirmation needed: Break and close above the red resistance zone.
🎯 Target: Green line level on a successful breakout! 🚀
PENDLEUSDTshort selling set up 📉
DISCLAIMER:
what I share here is just personal research, all based on my hobby and love of speculation intelligence.
The data I share does not come from financial advice.
Use controlled risk, not an invitation to buy and sell certain assets, because it all comes back to eac

It's time the ETH ecosystem gets some love. Leveraged beta plays
I'm going to go long ETH, and as a leveraged beta I'm taking a bet on PENDLE. It's like hating on D----ey world, Sometimes you might not like the decisions being made by the higher ups, but its still the top dawg L1.

PENDLEUSDT 📈 PENDLEUSDT 4H Analysis:
Price rebounded from the 2.444 demand zone after a short-term breakdown and is now stabilizing above the 200 EMA, with the bullish trendline still intact. Key resistance lies at 3.219, and breaking it could open the path to 3.602. However, a drop below 2.626 and the trendli

PENDLE/USDT Technical Analysis – April 9, 2025🔍 Market Structure & Price Action
PENDLE has recently bounced from a significant demand zone around the $2.00–$2.20 area, highlighted by the thick blue box at the bottom of the chart. This area has acted as strong support in the past and shows renewed buying interest, evident from the bullish revers

PENDLEUSDTPossible long after the retest on the support level.
RED = support
GREEN = recistance
YELLOW = trendlines + support/recistance

PENDLEI'm take short selling, cancel close position if break above strong high
RR 1 : 2
DISCLAIMER:
what I share here is just personal research, all based on my hobby and love of speculation intelligence.
The data I share does not come from financial advice.
Use controlled risk, not an invitation to buy

#PENDLE/USDT#PENDLE
The price is moving within a descending channel on the 1-hour frame and is expected to continue upward.
We have a trend to stabilize above the 100 moving average once again.
We have a downtrend on the RSI indicator, which supports the upward move with a breakout.
We have a support area a

long PENDLEPendle broke through the resistance level and the descending trendline. Bullish movement to $5.55 is expected to happen.

See all ideas
Summarizing what the indicators are suggesting.
Oscillators
Neutral
SellBuy
Strong sellStrong buy
Strong sellSellNeutralBuyStrong buy
Oscillators
Neutral
SellBuy
Strong sellStrong buy
Strong sellSellNeutralBuyStrong buy
Summary
Neutral
SellBuy
Strong sellStrong buy
Strong sellSellNeutralBuyStrong buy
Summary
Neutral
SellBuy
Strong sellStrong buy
Strong sellSellNeutralBuyStrong buy
Summary
Neutral
SellBuy
Strong sellStrong buy
Strong sellSellNeutralBuyStrong buy
Moving Averages
Neutral
SellBuy
Strong sellStrong buy
Strong sellSellNeutralBuyStrong buy
Moving Averages
Neutral
SellBuy
Strong sellStrong buy
Strong sellSellNeutralBuyStrong buy
Displays a symbol's price movements over previous years to identify recurring trends.