PEPE/USDT Potential UpsdesHey Traders, in today's trading session we are monitoring PEPE/USDT for a buying opportunity around 0.00001260 zone, PEPE/USDT is trading in an uptrend and currently is in a correction phase in which it is approaching the trend at 0.00001260 support and resistance area.
Trade safe, Joe.
PEPEUSDT.PS trade ideas

Important Point: 0.00001271
Hello, traders.
If you "Follow", you can always get new information quickly.
Have a nice day today.
-------------------------------------
(PEPEUSDT 1D chart)
The 0.00001271 point is the HA-High indicator point on the 1M chart.
Accordingly, the key is whether it can receive support near 0.00001271 and rise.
If it fails to rise, it is possible to re-determine the trend by touching the M-Signal indicator on the 1W chart.
The support area is near 0.00000723.
-
If it is supported and rises near 0.00001271, it is necessary to respond depending on whether there is support near 0.00001898-0.00002244.
-
I think the 0.00001271 point is a point where a breakout trade is possible.
However, caution is required because the StochRSI indicator is showing signs of entering the overbought zone.
Therefore, I think it is better to check for support rather than a breakout trade.
-
Thank you for reading to the end.
I hope you have a successful trade.
--------------------------------------------------
- This is an explanation of the big picture.
I used TradingView's INDEX chart to check the entire range of BTC.
I rewrote the previous chart to update it while touching the Fibonacci ratio range of 1.902 (101875.70) ~ 2 (106275.10).
(Previous BTCUSD 12M chart)
Looking at the big picture, it seems to have been following a pattern since 2015.
In other words, it is a pattern that maintains a 3-year bull market and faces a 1-year bear market.
Accordingly, the bull market is expected to continue until 2025.
-
(Current BTCUSD 12M chart)
Based on the currently written Fibonacci ratio, it is displayed up to 3.618 (178910.15).
It is expected that it will not fall again below the Fibonacci ratio of 0.618 (44234.54).
(BTCUSDT 12M chart)
I think it is around 42283.58 when looking at the BTCUSDT chart.
-
I will explain it again with the BTCUSD chart.
The Fibonacci ratio ranges marked in the light green boxes, 1.902 (101875.70) ~ 2 (106275.10) and 3 (151166.97) ~ 3.14 (157451.83), are expected to be important support and resistance ranges.
In other words, it seems likely to act as a volume profile range.
Therefore, in order to break through this section upward, I think the point to watch is whether it can rise with support near the Fibonacci ratios of 1.618 (89126.41) and 2.618 (134018.28).
Therefore, the maximum rising section in 2025 is expected to be the 3 (151166.97) ~ 3.14 (157451.83) section.
To do that, we need to look at whether it can rise with support near 2.618 (134018.28).
If it falls after the bull market in 2025, we don't know how far it will fall, but considering the previous decline, we expect it to fall by about -60% to -70%.
So, if the decline starts near the Fibonacci ratio 3.14 (157451.83), it seems likely that it will fall to around Fibonacci 0.618 (44234.54).
I will explain more details when the downtrend starts.
------------------------------------------------------

PEPE Phoenix Revival: The +70% Bottoming Pattern Confirmed
The PEPE/USDT daily chart from May 10, 2025, reveals a textbook "Phoenix Rising" pattern that signals an extraordinary trading opportunity currently unfolding. Trading at 0.00001305 with significant momentum (+5.50% on rising volume), PEPE appears poised for a massive recovery rally toward historical resistance.
---- Technical Structure: Bottoming Pattern Complete ---
After a prolonged downtrend from January 2025, PEPE has formed a perfect bottoming pattern with these key components:
1. Accumulation Channel Formation (yellow boundaries) - The March-April base-building phase where smart money quietly accumulated positions between 0.000005-0.000008
2. Channel Breakout Confirmation - The recent powerful green candle with expanding volume (28.17T) signaling institutional entry
3. Historical Supply Zone (purple rectangle) - This is the crucial 0.0000175-0.0000185 range that previously acted as support before the January breakdown
--- Trading Roadmap: The 66% Upside Play ---
The blue pathway illustrates the anticipated price movement, with three distinct phases:
Phase 1: Consolidation - After the initial breakout surge, price will likely form a higher low around 0.00001033 (marked as entry point), creating the ideal risk-reward opportunity
Phase 2: Stair-Step Advance - A series of higher highs and higher lows as price climbs through previous resistance levels
Phase 3: Target Achievement - Final push toward the 0.00001715 take-profit target, representing a 66% gain from the suggested entry point
--- Technical Reasoning: The Triple Confluence ---
What makes this setup particularly compelling is the triple confluence of factors:
1. Volume Confirmation - The breakout candle shows 5.50% gains on expanding volume, the textbook definition of genuine price movement
2. Historical Context - The current price structure mirrors almost identically the bottoming pattern seen in early 2024 before PEPE's previous major rally
3. Macro Alignment - This move coincides perfectly with the projected Bitcoin dominance decline (as seen in broader market analysis), creating ideal conditions for meme coin outperformance
--- Strategic Entry Plan ---
The optimal approach to this opportunity is to wait for the pullback to the 0.000010 level, which provides:
- Clear invalidation point (below 0.0000095)
- Exceptional risk-reward ratio (over 5:1)
- Confirmation of higher low pattern formation
4H VIEW HERE
The current market structure suggests this retracement will likely occur within the next 10-14days, creating the perfect entry window before the projected June rally toward the target zone.
This Phoenix pattern represents one of the clearest technical setups currently visible in the crypto market, offering a well-defined opportunity with precise entry, target, and invalidation levels.
HELP US WITH LIKE AND FOLLOW GUYS .. THANK YOU

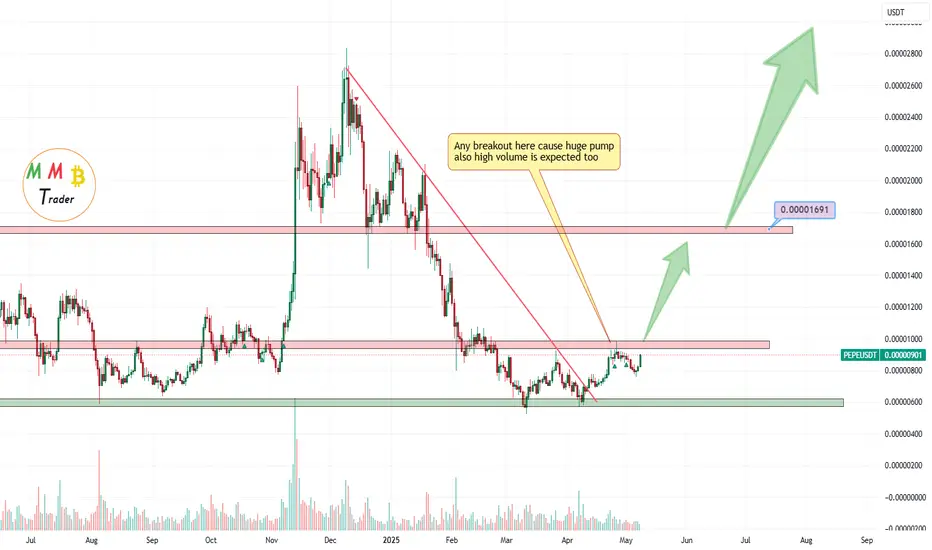
PEPEUSDT Heavy pump is aheadAs we can see price is near major resistance of 0.000010$ and soon this resistance will break to the upside and heavy pump will lead soon after that to the next targets which are mentioned on the chart with green arrows.
DISCLAIMER: ((trade based on your own decision))
<<press like👍 if you enjoy💚
Pepe 5X Lev. Full PREMIUM Trade-Numbers (PP: 1670%)The market always offers a second chance. The full trade-numbers below have targets up to 0.00003381 for a maximum profits potential for 1670%. The chart goes higher and reaches 2235% (0.00004264) and 3715% at 0.00006575.
How far up it goes and how fast is for the market to decide.
These trade setups are good if we can catch the bullish breakout, once the breakout is in, the rest is an easy wait.
I know some people that are happy to secure their trades after 200-300%, some even at 100%. Others wait long-term because these are awesome chart setups and can reach much higher. In past cycles we've done trades with more than 10X easily. This is one of those.
The question is, will it hit or will it fall?
The market always offers a second chance and a second chance is upon us, now.
Full trade-numbers below:
_____
LONG PEPEUSDT
Leverage: 5X
Entry levels:
1) 0.00000810
2) 0.00000715
3) 0.00000690
4) 0.00000630
Targets:
3) 0.00000867
4) 0.00001071
5) 0.00001222
6) 0.00001408
7) 0.00001681
8) 0.00001953
9) 0.00002342
10) 0.00002836
11) 0.00003381
Stop-loss:
Close weekly below 0.00000625
Potential profits: 1670%
Capital allocation: 5%
_____
Why Pepe and not some other Altcoin?
I shared trade-numbers for you for pairs as varied as Bitcoin and Ethereum, Notcoin and Dogs, Solana and Filecoin, Pepe, EOS, XRP, Cardano and Compound, to name a few. The truth is that I pick what in the moment looks good.
Market conditions can always change, but at the time of writing the chart looks great.
Notice that the action is 100% full red, that's the time to buy as I always remind and say; Buy when prices are low or trading near support; buy when the market is red.
The market is red now and that's the time to buy before a reversal happens. You will see, our time to sell comes when the market turns green.
Many average players will do it in reverse, right now they are selling and they will buy at the top of the bullish wave. I know, it is tempting, it is the market impulse but we have to learn to control our emotions if want success in this game.
There is risk involved. Leveraged trading is for experts only.
Thanks a lot for your continued support.
Namaste.

PEPE Breaks Out! 22% Move Toward 0.000016 PossibleHello and greetings to all the crypto enthusiasts, ✌
All previous targets were nailed ✅! Now, let’s dive into a full analysis of the upcoming price potential for Pepe 🔍📈.
PEPE has successfully broken above multiple key daily resistance levels, accompanied by solid bullish volume 📈. This breakout suggests strong momentum, and I anticipate a continued upward move with a minimum 22% potential upside. The main target is set at 0.000016 , aligning closely with a significant Fibonacci support zone. 🚀
🧨 Our team's main opinion is: 🧨
PEPE broke key daily resistances with strong volume, aiming for a minimum 22% move toward the main target at 0.000016 🚀.
Give me some energy !!
✨We invest hours crafting valuable ideas, and your support means everything—feel free to ask questions in the comments! 😊💬
Cheers, Mad Whale. 🐋

PEPE It has growth potentialFinally, this pattern was broken and had a positive impact, leading to significant growth. Now, with a slight price correction, higher price levels can be reached.
Stay Awesome , CobraVanguard.

PEPE BUY ...Hello friends
Due to the price drop, good conditions have been created to buy with risk and capital management and move towards the specified goals...
If you are risk-averse, this signal is for you...
*Trade safely with us*

Pepe: Not Financial Advice—Opportunity, Learning & EntertainmentWe reached the point of no return. Mentioning the easy, secure and certain 245% on the Vechain chart got me thinking; this is the real deal, it can be life changing for those who take action and with the opportunity to take action. Are you listening to me? This is it!
This is all done for your entertainment, but this information can change your life in a positive way. This is all done for learning purposes only, the content, but you can make huge money if you decide to trade. Of course, money can also be lost but that is if you approach the market with a skewed mindset and unprepared.
I am not sharing financial advice, I am only telling you my opinion. I believe that timing is great. You should take this opportunity if you have the ability to do so. I understand, not all of us can buy and benefit from this situation and those that can't are excused. But what about you? Do whatever it takes and join the ride. It will be great. No leverage, no margin, no risk. With spot trading, the worst case scenario turns into a long-term wait. With reputable projects/pairs, there is no going wrong. The market is trading at bottom prices and will soon grow.
People that are advanced in their lives; stable relationship, control of their emotions, good habits; fresh air, healthy food, can take the time to study how margin works. Put leverage on your trades and boom! I don't need to say anymore.
PEPEUSDT. This channel's low happened in April 2024. Two main highs and two main lows.
The current pattern, the short-term higher low depicted on the chart, can launch the next bullish wave. I sense some weakness, there can be one final shake on this pair. If you are trading spot, this is irrelevant because the market will eventually grow. If you are using leverage, you should be prepared for all scenarios and know that some trades can be lost. That's it.
The numbers are huge on this one. I am seeing 480% and almost 800% on the 2.618. These are good. Whatever you do is up to you. Take responsibility for your actions, do not blame others for your mistakes. I am sharing charts but the market will continue to fluctuate. I can make a prediction and this prediction goes wrong, but it is you who decide which pair to buy and hold. I can make another prediction and this one does great, still, it is your choice if you bought the winning or losing pair.
If you cannot accept the responsibility for your own actions, do not trade. Stop reading now. This is not financial advice. I am sharing my opinion and reading charts for your personal growth, learning and entertainment.
Namaste.

$PEPEUSDT about to make a huge bullish moveAfter a long bearish move, BINANCE:PEPEUSDT has finally broken out of its bearish trendline and also a resistance zone. It is about to retest the resistance zone which will turn to a support zone, and then kick-off a huge bullish rally to the previous ATH (All Time High), and possibly way above it.
Be on the look out and expect minor retracements while at it as there are some support and resistance zones it can bounce off from. These zones are already marked out in the setup.
Do comment your thoughts regarding the analysis, and boost it so it gets to others.

PEPEUSDT - Now waiting for another 100% move.It already made a 100% move from the zone we mentioned earlier, breaking the downtrend line with a massive bullish candle on the 3-day timeframe.
It’s now on its way to forming a new all-time high (ATH).
Best regards Ceciliones 🎯

PEPE – 2x Move Looks ImminentOne of the strongest alt structures right now.
Given how well it’s held previous swing lows—and the recent deviation and retest—it’s pretty clear where this is headed.
This is a longer-term play. It might take weeks to reach the yearly open, where I’ll look to offload, or slightly earlier depending on how it reacts to the weekly block.
Also worth noting: PEPE is one of the few alts still maintaining an active weekly uptrend.
BINANCE:PEPEUSDT CRYPTOCAP:PEPE

PEPE 1D Harmonic Pattern Setting Up for a Bullish Breakout!Hey traders!
I'm spotting a potential bullish setup on #PEPEUSDT — and it’s one worth watching closely.
🔍 Technical Overview:
On the 1D time frame, #PEPE is forming a textbook harmonic pattern — still confirming.
No bearish divergence or reversal signs spotted so far — momentum remains intact.
Key level to watch: B point of the harmonic pattern, acting as strong horizontal resistance.
🎯 Trade Idea:
Plan: Wait for a clean breakout above the B-level, followed by a successful retest.
If the retest holds as support, I’ll be entering a long position with tight risk management.
TP-1: 0.00001292
TP-2: 0.00001647
SL: 0.00000549
⚠️ Why patience matters: Jumping in too early can expose you to fakeouts. Confirmation = confidence!
💬 What do YOU think? Is #PEPE about to explode or will the resistance hold? Drop your thoughts below! 👇
📈 If you find this helpful, don’t forget to: 👍 Like
💬 Comment
🔁 Share
📌 Follow me for more high-probability setups!
Let’s trade smart, not emotional. 💡
#PEPE #CryptoTrading #HarmonicPattern #BreakoutSetup #TechnicalAnalysis #TradingView #CryptoCommunity #Altcoins

Is Pepe Setting Up for a Quick 20% Run? Targets 0.0000900 Hello and greetings to all the crypto enthusiasts, ✌
All previous targets were nailed ✅! Now, let’s dive into a full analysis of the upcoming price potential for Pepe 🔍📈.
Pepe appears to be in a favorable position for a short-term trading opportunity. I'm targeting a minimum profit of 20%, with a price objective set at 0.0000900. This setup suggests a potential for quick gains, assuming market conditions remain supportive.📚🙌
🧨 Our team's main opinion is: 🧨
Pepe looks like a solid short-term buy with a target of 0.0000900 and at least 20% profit potential if the market holds up. 📚🎇
Give me some energy !!
✨We invest hours crafting valuable ideas, and your support means everything—feel free to ask questions in the comments! 😊💬
Cheers, Mad Whale. 🐋

PEPE Testing Purple Resistance – Bullish Pattern Formed!🚀 CRYPTOCAP:PEPE Testing Purple Resistance – Bullish Pattern Formed! 📈
CRYPTOCAP:PEPE is currently testing the purple resistance line and has formed a bullish pattern! 📊 If the price breaks through, the target could be the green line level! 🔥
Let’s ride this breakout together! 💼💸

PEPE | BULLSH | ALT can +150%PEPE seems to have bottomed out after flashing bullish signs on the chart.
Once we close ABOVE the 50 day moving averages (green line) in the weekly timeframe, that's when we'll know the bullish action is full steam:
Make sure you don't miss the update on BTC here:
______________________
BINANCE:PEPEUSDT

Weekly plan for PEPEIn this idea I marked the important levels for this week and considered a few scenarios of price performance
The price has already reached the support level and if the price falls under it, it will aim for the second support zone. RSI is already showing bullish divergence, but it is possible to see a sharp decline before an upward correction
Write a comment with your coins & hit the like button and I will make an analysis for you
The author's opinion may differ from yours,
Consider your risks.
Wish you successful trades ! mura

PEPE at Range Support After 0.618 Fibonacci Rejection – Decision
Key Highlights:
Rejected from the 0.618 Fib retracement, a key technical resistance.
Testing value area low — critical support within current range.
If broken, expect a rotation to the point of control, offering potential bounce setup.
Full Analysis:
PEPE’s failure to break through the 0.618 Fibonacci resistance has triggered a short-term pullback. The current price is barely holding the value area low, a crucial support that separates continuation from correction. A loss of this level opens the door for a rotation to the point of control (POC), where we again see a 0.618 Fib confluence — making it a major decision zone for bulls.
If the POC holds, a potential higher low could be established — keeping the broader uptrend intact. However, a break below POC would weaken the bullish structure and shift momentum back to sellers. Watch for volume confirmation and candlestick signals to validate any setups from here.
Bias:
Leaning bullish on reclaim of value area low.
Cautious bearish if price loses POC cleanly.

PEPE Ready for a 20% Bounce, Targeting 0.00001070Hello and greetings to all the crypto enthusiasts, ✌
All previous targets were nailed ✅! Now, let’s dive into a full analysis of the upcoming price potential for Pepe 🔍📈.
PEPE looks set for a short-term rally, with a potential 20% upside, targeting 0.00001070. The meme coin is currently sitting at a crucial support zone, making it a prime spot for a breakout. 🚀 A strong bounce from here could drive significant gains in the coming days.📚🙌
🧨 Our team's main opinion is: 🧨
PEPE is primed for a short-term rally with a potential 20% gain, targeting 0.00001070, as it's currently sitting at a key support zone. 📚🎇
Give me some energy !!
✨We invest hours crafting valuable ideas, and your support means everything—feel free to ask questions in the comments! 😊💬
Cheers, Mad Whale. 🐋

PEPEUSDT huge rise ahead As we cans see price broke red trendline and market here is getting bullish but one last resistance zone which is 0.000010$ is holding price down and now is last and major resistance zone also soon we can expect breakout there to the upside and possible pump like green arrows are ahead.
DISCLAIMER: ((trade based on your own decision))
<<press like👍 if you enjoy💚

PePe - weekly planIn this idea I marked the important levels for this week and considered a few scenarios of price performance
If the local trend lines will be broken, we can expect a downward correction to the 0.5 Fibonacci level. But if the price can break through the local resistance, there are chances to renew the local top and reach the target 1
Write a comment with your coins & hit the like button and I will make an analysis for you
The author's opinion may differ from yours,
Consider your risks.
Wish you successful trades! MURA


BUY PEPE ...Hello friends✌
As you can see in the picture, we have specified a purchase range for you to buy in stages, of course with capital and risk management.
🙏If you like it, support it with a ✔like✔ and ✔comment✔.
*Trade safely with us*
