Will PEPE continue to grow?📊 According to analysis, the #Pepe currency witnessed an 8% drop in 1 day and 16 hours.
✔️ Now, according to the analysis, we are witnessing a price reversal after reaching the aforementioned support.
🔼 There is a 7% probability of a return for this currency.
⚠️ And if the support breaks down to the lowest weekly support price, 0.00001600, we will be 10% lower.
PEPEUSDT.PS trade ideas

PEPECOIN TO 13 IF DOES NOT BREACH 19Earlier target of 1740 reached. This is an update. If pepe does not breach 19, it will deep further into 13. Hopefully not lower.

PEPE/USDT - Rising Channel with FVG Fill TargetTECHNICAL ANALYSIS: 🐸
Price Structure:
- Current price: $0.0001938 (+0.26%)
- Timeframe: 4H
- Trading within ascending channel
- Fair Value Gap (FVG) identified on 1D
Key Levels:
- Support zone: 0.000018-0.000019
- Resistance zone: 0.000026
- Target: 0.000014 (80.30% potential)
Technical Observations:
- Strong ascending channel since November
- 1D FVG (Fair Value Gap) needs filling
- Price showing consolidation at channel support
- Moving average (SMA) providing dynamic support
Trade Setup:
▪️ Entry Zone: 0.000017-0.00019
▪️ Target: 0.000032 (80.30%)
▪️ Stop Loss: Below channel support
▪️ Key resistance break: 0.000026
Risk Management:
- Channel support must hold
- Volume confirmation needed for breakout
- Tight stops below channel support recommended
Timeframe: 4H
Bias: Bullish within channel
Pattern: Ascending Channel
Note: Meme coins are highly volatile. Use proper position sizing. This is technical analysis only. DYOR.
#PEPE #Crypto #TechnicalAnalysis #Binance CRYPTOCAP:PEPE
Key Point: Watch for volume confirmation at FVG fill levels for potential reversal signals.

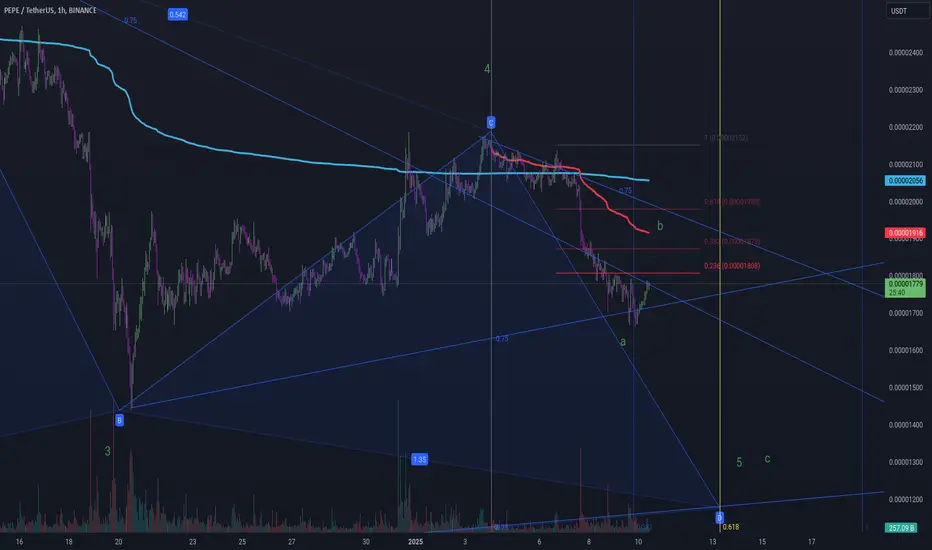
Pepe 4 to 5 Wave Zoomed Be careful with the corrective ABC pattern leading to Wave 5. Red line resistance Anchored VWAP from high of wave start.
Fibs drawn from C minor of 4 major Wave and not (4) to c minor.. to get resistance levels. Be careful because Wave 3 (C) is the longest wave. Nice long ride
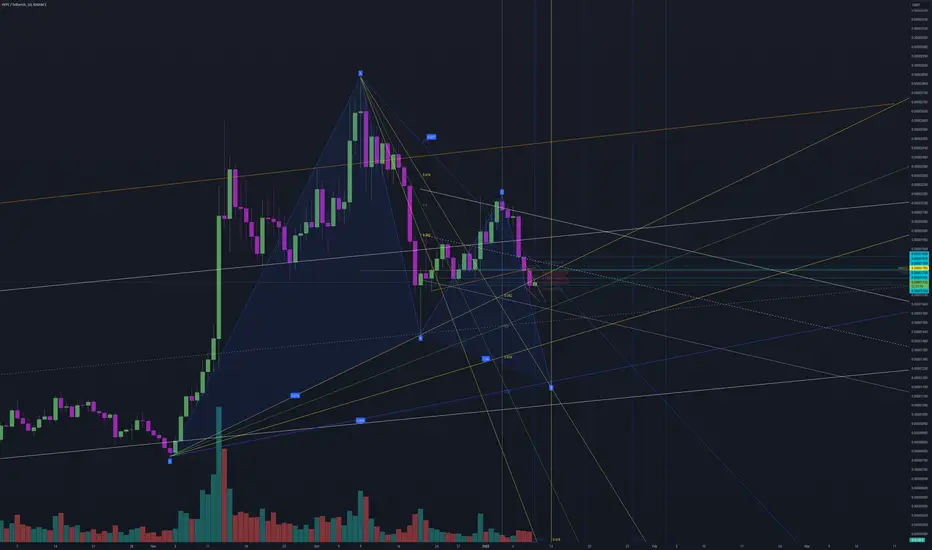
Pepe Gartley and Elliot WavesLast Wave GOT ME! and now I see!
Sorry such a short description but highly recommend book: ELLITT WAVE FIBONACCI HIGH PROBABILITY TRADING by Jarrod Sanders
HIGHLY RECOMMEND - Chart Champions!

Pepe Speed Resistance What is going on here? Ive been reading books and studying Elliot Waves. This i mental. Random?

PEPE Speed FANSpeed resistance fan drawn from the lowest low to highest high. and visa versa with second speed resistance fan. Then..
2nd high to 2nd highest low..
Interesting points are saying something here. I dont know what other than support v resistance
OBSERVATION!

PEPE or Bitcoin?Memecoins like PEPE are not just random internet jokes—they’re evolving into financial instruments that mirror Bitcoin’s price patterns. As Bitcoin climbs, so does PEPE, and when Bitcoin takes a dip, memecoins like PEPE follow suit.
Just check the graph how similar they are.
PEPE Follows Bitcoin: Why we see the Correlation?
1. Liquidity and Market Sentiment:
Bitcoin dominates the crypto market, often serving as a barometer for investor sentiment. When BTC rises, it lifts the overall market, including memecoins like PEPE. Conversely, a Bitcoin slump sends ripples of fear through the crypto community, dragging PEPE down as well.
2. Institutional Impact:
Institutions have begun to recognize Bitcoin as a legitimate asset, driving its adoption and price stability. While memecoins don’t enjoy the same institutional backing, they still benefit indirectly from Bitcoin’s market moves, as investors pour profits into high-risk, high-reward assets like PEPE during bull markets.
3. Speculation and Herd Mentality:
The memecoin market thrives on speculation. When Bitcoin rallies, retail investors often seek “the next big thing,” leading them to memecoins. PEPE, with its meme-worthy branding and vibrant community, becomes an attractive option.
So what will be your take? Is there a point to be in PEPE at the stage, when you see clear simulation pattern? Or you enjoy the volatility?

Pepe Trend Based Fib FanCoincidence? Trend based fib from lowest low to highest high hit the 0.75 and 0.618 fib level for Wave 3. Wave 5 trend based fib from lowest low to 2nd highest high "to hit" the 0.75 ? Hmm

Pepe ig Time Frame GarleyIve been studying Elliot Wave and lost in all the waves. This is my big picture.
MY FAVORITE MEMECOIN - PEPE!Reasons to long in the PEPE coin
1. The price is at the level of strong support, where a large liquidity squeeze was made
2. Divergence between the price momentum and volume, which may be caused not by panic selling, but by the lack of sufficient liquidity in the order book (whether such absences are accidental or not - decide for yourself))
Expectations : Possible margin call of longs below the level of 0,00001656 with a reversal movement upwards

PEPE Update on current situationI'll elaborate on updates but I wanted to share a short info about BINANCE:PEPEUSDT and how I see it.
Pepe is currently slightly bellow of the VAH of the range. it fell, again , into the downward channel and goes again (as of now) bellow the VAH. BUT on the left side u can see the high of may/june which functions as a support zone (dotted line) - it already bounced off of it once during december (disregarding the wick deeply into it but that was a flash crash) and hols it so far.
if BTC doesn't f*ck up completely, then PEPE could bounce from that and push towards the POC at 2100 and the VAH at 2500 again. Once a new HH (higher high) from the past lower high is established, it should invalidate the downtrend and find new , stronger support around the POC area and push higher from there.
it all depends on BTC and the market sentiment regarding Trump, Fed, recession etc. but the moment PEPE breaks above again, and I'm certain it will, it'll go for 3000 and up. nobody knows how high it'll still go in this run but I bet it at least will touch 4000 in the next months.

PEPE looks bearish (1D)PEPE seems to be completing a diametric pattern and is now entering wave F.
Wave F is bearish. The drop in wave F is expected to continue until it reaches the green zone.
Targets are marked on the chart.
A daily candle closing below the invalidation level will negate our buy outlook.
For risk management, please don't forget stop loss and capital management
Comment if you have any questions
Thank You

Pepe Coin (PEPE): Possible Re-Test Before Going For Buy ZonePepe coin has a possibility to re-test the upper MSB zone, which would give us a 7% upward movement, but we are still interested in testing the lower support zone on a bigger timeframe (1D) before having another possible ATH!
More in-depth info is in the video—enjoy!
Swallow Team

PEPE USDT Support Zone:How to React to a Rebound or BreakoutThe price has dropped and reached a strong support zone, showing a strong reaction from buyers. Now, we can expect either a rebound and continuation in the buy direction or a break of our zone with the price continuing in the sell direction. However, we must be cautious of a potential false breakout, so it's important to wait for market confirmation.

PEPEUSDT: Trend in 1H time framevery important levels,
Please pay special attention to the colored levels.
>>>>>>>>>>>>>>>>>>> very sensitive <<<<<<<<<<<<<<<<<<<<<<<<
Be careful
BEST
MT

PEPE in the coming days!BINANCE:PEPEUSDT
Pepe is forming a bullish pattern.
It hasn't been completed yet!
the price shall increase after complition.
It's a double bottom pattern.but MACD shows a bearish signal which is fine cause we want to see the second bottom created!
⚠️ Disclaimer:
This is not financial advice. Always manage your risks and trade responsibly.
👉 Follow me for daily updates,
💬 Comment and like to share your thoughts,
📌 And check the link in my bio for even more resources!
Let’s navigate the markets together—join the journey today! 💹✨

symmetrical trianglehi we have a symmetrical triangle that has broken the lower line of triangle and the last pivot of triangle and we hope that the price going down to 0.00001981 or more to 0.000195.


Lingrid | PEPEUSDT range BREAKOUT. Potential Buying OPPORTUNITYBINANCE:PEPEUSDT has been in a consolidation phase for over a week. Recently, it broke out and closed above this zone, reaching levels above 0.00002. Now, it's pulling back to retest that consolidation area. The price has been following a downward trendline, and if it rejects that trendline again, we could see a bullish move. On the daily timeframe, the price bounced off the support level, forming a long tail bar, which is a positive sign. I expect the market to retest the middle of the consolidation zone that often acts as support and resistance, followed by continuation upward move. My goal is resistance zone around 0.00002185
Traders, if you liked this idea or if you have your own opinion about it, write in the comments. I will be glad 👩💻

#PEPE is About to Breakout!#PEPE is About to Breakout ✅
Get ready for the upcoming move!
Stay tuned for more
DYOR, NFA
#Crypto #Altseason2025

PEPE/USDT Ascending Channel Breakout WatchThe price is currently moving within an ascending channel pattern, indicating a potential bullish continuation. A breakout to the upside is expected, but confirmation is key. We'll look to accumulate PEPE near the lower trendline support around 0.0001995 for a long position. The breakout target is set at 0.0002412, offering a promising risk-to-reward opportunity. Ensure proper risk management by placing stop-losses below the lower trendline. Keep an eye on volume during the breakout attempt for stronger validation.

#PEPE. Accumulation Insights: Preparing for Price MomentumAt the moment, the price is in an accumulation phase, and I would look for entry points in case of a correction, ideally as close as possible to the lower boundary of this structure ($0.00001800 - $0.00001700). Personally, I plan to buy exclusively within this range.
If the condition with volumes and the support level is met, this could lead to upward price movement toward the next resistance level, where the price may once again encounter difficulties in continuing to rise (we’ll monitor the situation as it unfolds).
DYOR.
