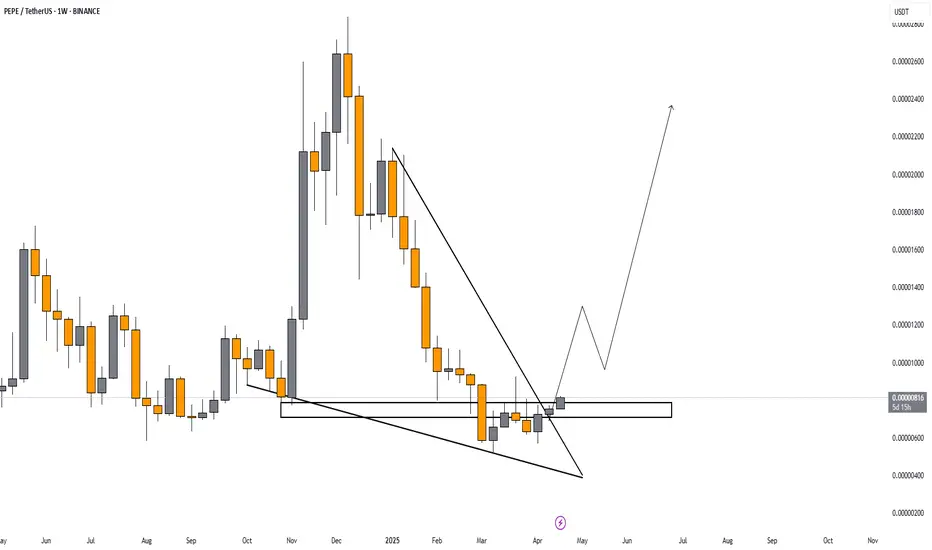
PEPE/USDTPEPE/USDT currently looking good for long term, break downtrend resistance with good volumes. Show the divergence from support line.
PEPEUSDT.PS trade ideas


PEPE decision timepepe is at a key level now
if we break out 0.000009252 is target
if we fail to break out we go back to 0.000007614

All-in-One Trading IndicatorAll-in-One Trading Indicator
Overview
Introducing an all-in-one trading indicator that empowers you to trade effectively without the need for expensive premium subscriptions. This innovative tool not only saves you money but also equips you with the insights necessary to make informed trading decisions.
Key Benefits
1. Cost-Effective Solution
No Premium Fees: Say goodbye to costly subscriptions. Our indicator provides all the essential features you need for successful trading without the financial burden.
2. Comprehensive Features
Multi-Timeframe Support: Works seamlessly across all timeframes, from minutes to daily charts, allowing you to adapt your trading strategy to your preferred style.
Trend Analysis: Easily identify market trends with clear visual signals.
Entry and Exit Points: Receive automated alerts for optimal entry and exit opportunities.
Target Price Suggestions: Get reliable target price recommendations based on historical data.
3. Empowerment Through Knowledge
Informed Trading: Make decisions based on solid data rather than speculation, enhancing your trading strategy.
For more details and to learn how this indicator can transform your trading experience, feel free to direct message me.


Trend Shift Alert: $PEPE Closes Above Resistance + EMACRYPTOCAP:PEPE has closed above the 50 EMA after reclaiming a key resistance zone, previously acting as support. This breakout is a strong technical signal suggesting a trend reversal may be in play.
RSI is climbing and currently sits near 63, indicating increasing buying strength but not yet overbought.
If price holds above the reclaimed zone and the 50 EMA, it could trigger a continued move upward toward previous highs.
DYOR, NFA

PEPE is waking up from the floor!🚀 CRYPTOCAP:PEPE is waking up from the floor!
Fibonacci Confluence Zone held strong around 0.00000507, showing accumulation at historical support.
Price broke out of a multi-month downtrend and is starting to show bullish structure.
Momentum building with weekly bullish candles and reclaiming key levels.
🎯 Targets:
• 0.00002072
• 0.00002789
PEPE Higher Low| Price Action| Trend Pepe is facing local resistance after a bounce, but this isn’t necessarily bearish. The current level aligns with strong confluence, and a rejection here could actually set up a bullish higher low if support holds just below.
Key Points:
Price is reacting to the 0.618 Fib and value area high — a key technical resistance zone.
Liquidity build-up below may trigger a sweep near the point of control before a bounce.
If Pepe dips into the support zone near the point of control and reclaims the level, it could confirm a higher low and spark a rally back toward recent highs. The 35% move is possible if broader market strength aligns. If support fails, expect a deeper retrace.

Global scenario for PEPEIn this video I considered the global possible price movement, also made possible scenarios for the current week
Write a comment with your coins & hit the like button, and I will make an analysis for you
The author's opinion may differ from yours,
Consider your risks.
Wish you successful trades! MURA


#PEPEUSDT The next 2x opportunity is on the horizon! 🌐 **Buy Zone:** Around 0.000009740
🎯 **Targets:** 0.00001580, 0.00002034, 0.00002665
📈 **Potential Gain:** Up to 175% in spot
Always prioritize risk management and adjust your position size accordingly to protect your capital! Consistency and caution lead to long-term success. 📊🔑

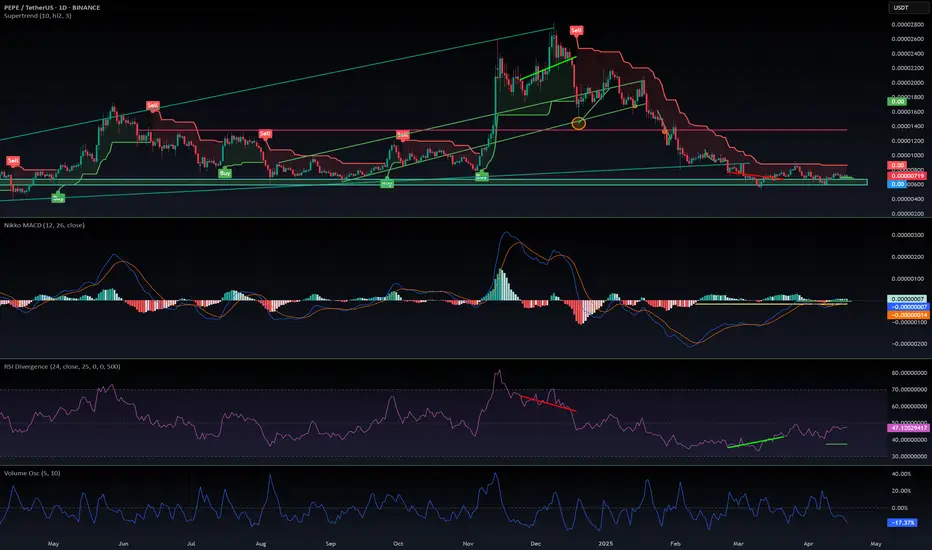
$PEPE looks ready to leap again!CRYPTOCAP:PEPE looks ready to leap again! 🐸
After its massive December 2024 rally, CRYPTOCAP:PEPE has undergone an equally strong correction — but signs suggest the bottom is in.
✅ Strong support at 0.0000700 and 0.0000650
✅ MACD stabilizing
✅ RSI showing a huge bullish divergence
Momentum is building — don’t lose sight of the frog! 🐸🚀
DYOR
#PEPE #Altcoins #CryptoTrading #BullishSetup #RSIDivergence #MemeCoinSeason #CryptoAlert #PEPEArmy
PEPE : WHAT WE WANT?Hello friends
Given the good price growth, we see that we had a correction, which we found the support area using Fibonacci, and the price has returned from that area by buyers and is now in an ascending channel, which we expect to move to the specified targets.
Trade safely with us

69Billion Market Cap Target Current Market Structure:
Price at time of analysis: ~0.00000729 USDT.
The market had a sharp drop, consolidated, and now appears to have bounced from support near 0.00000580.
Price is forming a potential bullish reversal and has broken above a falling wedge, which is typically a bullish pattern.
📈 Trend Channels and Support/Resistance:
The chart uses parallel channels to identify market direction. PEPE seems to be respecting an upward trend channel.
Key support/resistance levels:
Support: 0.00000580, 0.00000359
Resistance: 0.00001717, 0.00002834
Target zone: Around 0.00016000 (as marked on the chart)
📊 Projection (Light Blue Path):
The light blue projection shows a bullish scenario:
Gradual growth till mid-2025
Strong breakout afterward toward 0.00016000
This would imply a massive rally — potentially more than 20x from current levels.
🧠 Conclusion / Sentiment:
The overall bias based on this chart is bullish.
Ideal entries may have been around the wedge breakout (around 0.00000580).
Conservative traders might wait for confirmation above 0.00000900 (near resistance).
Long-term target: 0.00016000, but expect pullbacks and consolidations along the way.

Is PEPE About to Crash from Here? Key Bearish SignalsYello, Paradisers — have you been watching PEPE closely? Because if not, you might be walking right into a trap. We warned about this bearish setup in advance, and right now, PEPEUSDT is flashing multiple red flags that every serious trader needs to be aware of.
💎PEPE is currently sitting under heavy pressure at a confluence of resistance — the 200 EMA, the Fibonacci golden pocket, and a major supply zone. And here’s the critical part: it has just printed a bearish CHoCH (Change of Character), significantly increasing the probability of a deeper move down.
💎On top of that, the daily timeframe is showing bearish divergence, a classic warning sign that momentum is fading, while price tries to push higher. These conditions are aligning to suggest that the bulls may be running out of fuel.
💎If we do get a pullback, there’s potential for a high-probability short entry around the breaker block and the Fair Value Gap (FVG) zones — so keep a close eye there.
💎But be careful — this setup isn’t bulletproof.
💎If PEPE breaks out and closes a candle above our invalidation level, the entire bearish bias gets invalidated. In that case, the best move will be to stay on the sidelines and wait for stronger confirmation. Never force trades — especially in this kind of volatile setup.
🎖Strive for consistency, not quick profits. Treat the market as a businessman, not as a gambler. Our focus remains on executing only the highest-probability setups with proper risk management.
MyCryptoParadise
iFeel the success🌴

The strat I use 📌 Strategy Overview
This is, by far, the simplest indicator-based entry strategy I’ve come across—and surprisingly, it's also one of the most effective for me. The chart and accompanying Pine Script are purely for demonstration, showcasing what is possible rather than everything required for success.
⚠️ Important Note:
The version shown on TradingView is just a small part of what makes this strategy profitable for me. Don’t be misled by the profit ratio —drawdowns are inevitable, and there’s much more going on behind the scenes in the Python version.
🧠 What the Pine Script Does
This TradingView Pine Script defines a long-only strategy that operates exclusively between April 11, 2025, and January 1, 2026. It uses:
RSI
Stochastic RSI (%K & %D)
Customizable EMA crossover
Buy Signal:
Occurs when the smoothed StochRSI %K line crosses above a user-defined lower threshold and a short-term EMA is above the long-term EMA—indicating bullish momentum.
Sell Signal:
A take-profit exit occurs once a profit target is hit based on the current market price.
A stop-loss is triggered if the %K line crosses below the %D line—signaling weakening momentum.
Additionally, a hard stop-loss is built in as a safety net in case indicator logic fails.
🔧 How I Use This Strategy in Real-Time (Python + Binance API)
Backtesting Engine (Every 12 Hours)
Runs 100,000+ randomized combinations of strategy parameters on the past 12 hours of data.
Fine-tunes the top-performing set with another 10,000 passes.
Automatically updates the real-time trading config with optimized values.
Real-Time Trading Engine
Pulls fresh data at startup to calculate indicators.
Switches to WebSocket to aggregate 1m candles into 15m (optionally 10s, 20s, or 30s resolution—beware of API limits).
Uses manual indicator logic (sorry, secret sauce) with help from:
pandas for data manipulation
numpy for math ops
requests for resilient API handling
Only python-binance for API—Binance changes their endpoints too often to rely on anything else.
Candle Syncing
I only trade with candles aligned to Binance’s 15-minute intervals.
My preferred timeframe is 15m to 4h—I avoid higher timeframes like weekly/monthly due to increased exposure to smarter bots, institutional manipulation, and emotional retail traders.
Order Execution Logic
Entry size = average of top 3 sell orders (never more than 5% of that total).
Backtesting decides whether to enter via MA2, MA3, market price, or slightly above average bid.
All exits are via Market Order for speed.
No Indicator-Based Exits
Profit-taking exits are determined by inspecting the live order book and price action for buy/sell walls. Indicators are too slow for this.
Mindset & Manual Oversight
Avoiding greed is the hardest part—it often leads to panic buys/sells and overconfidence.
Stay humble, inspect live charts manually, and be ready to pause the script if candle patterns look suspicious or bot-like.
I’ve completely abandoned using webhooks or Power Automate flows for TradingView alerts—they’re too slow.
⚠️ IMPORTANT
If you’re a coder (or know one), you can convert this Pine Script into Python. But I strongly discourage going live and I not responsible if you choose to do so.
For me trading is never set-and-forget.

PEPEUSDT 2DPEPE ~ 2D Analysis
#PEPE Buy after successfully penetrating this resistant line with a short -term target of at least 15%+ from here.

PEPE/USDTTrend & Pattern
Downtrend: Since mid-December 2024, the price has been in a downtrend, as shown by the falling trendline.
Potential Reversal: A breakout from the descending trendline seems to have occurred recently (early April 2025), suggesting a potential trend reversal.
Key Levels
Support Zone: Around 0.00000580 USDT, where price has previously bounced multiple times (strong demand zone).
Resistance Zones:
0.00000850 – 0.00001000 USDT: First major resistance area, also near the 200 EMA (~0.00001098).
0.00001300 – 0.00001500 USDT: Next resistance if the price manages to break above 0.00001098.
0.00001717 USDT: Final target shown on the chart (upper resistance).
Indicators
200 EMA (Blue Line): Currently above the price (~0.00001098), acting as dynamic resistance. A breakout above this would confirm bullish momentum.
Potential Scenarios
Bullish Case (as drawn):
Price breaks above the current level and retests the breakout area (~0.00000850).
Continues to climb toward the 200 EMA (~0.00001098).
If that breaks, the price could move toward the 0.00001300–0.00001500 region and possibly to 0.00001717.
Bearish Rejection:
If rejected at resistance (~0.00000850 or 0.00001098), price may fall back to the support region around 0.00000580.
Conclusion
The chart suggests a bullish breakout scenario is in play.
A close above 0.00000850 would be a good bullish confirmation.
Watch 0.00001098 (200 EMA) closely—if broken, the uptrend may gain strong momentum.

Opportunity in PEPEUSDT PEPEUSDT has just broken its previous high and is attempting to retrace to the 0.00000665 - 0.00000656 range. This could present an opportunity to join the uptrend.
Price reversal confirmation >0.00000679.
Upside target 0.00000728 - 0.00000737.
Invalid level below 0.00000663

PEPE/USDT:BUY!!!Hello friends
Due to the heavy price drop we had, the market has fallen into fear and the price has been well supported in the specified support area, according to which we can buy in steps in the specified areas with capital and risk management and move to the specified goals.
Always buy in fear and sell in greed.
*Trade safely with us*

Here's about 50% profit or loss!PEPE is stuck in a descending channel for about 4 months. Now, it can break the channel and pump toward ~$0.0(4)105 (blue wave), or it can continue to fluctuate in the channel and correct to at least ~$0.0(5)450.

PEPEUSDT Eyes the Sky!BINANCE:PEPEUSDT has shown a strong bounce from a key support level, signaling potential for a continued bullish move. The overall market sentiment is positive, which could act as a catalyst for further upside. With the price structure leaning bullish and momentum picking up, there’s a good chance we’ll see higher highs in the coming sessions. Traders should keep an eye on the next resistance zone as a possible target while maintaining disciplined risk management. Always trade with a clear plan—and most importantly, don’t forget your stop loss!
$1000PEPEUSDT Currently trading at $0.00735
Buy level : Above $0.0071
Stop loss : Below $0.0056
Target : $0.0145
Max leverage 3x
Always keep Stop loss
Follow Our Tradingview Account for More Technical Analysis Updates, | Like, Share and Comment Your thoughts
