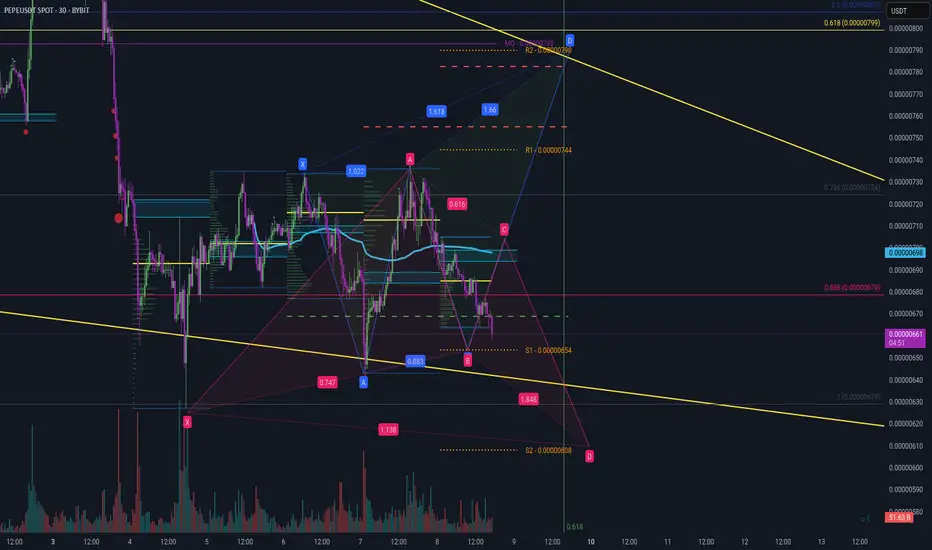
Pepe - Internal Bullish & External Bearish Gartley - 11/03/2025Fistly, the only harmonis I can find that extends so far on C or D is shark harmonic. Not sure if these are actually valid however, I'm finding them useful to guage on fib retracements at very least!
Internal Gartley in Red - Target A - Mediumm term
External Gartley in Blue - Target D (Best case) at 1.618. Taking us to those evil 3 peaks!
Given these analysis on BTC and Futures, I'm pro bullish.
Just an idea. Happy trading. :)
PEPEUSDT.PS trade ideas

Pepe Daily Targets 08 March 2025Hi guys, just thought to post my ideas for a setup.
Bullish Gartley at S2 retracement (RED)
Bearish Gartley at S1 retracement (BLUE)
Wait for confirmations - don't rush into any trades.
PEPEUSDT 2DPEPE ~ 2D Analysis
#PEPE If you still have a Conviction on this coin, maybe this support you can consider to start buying back with a short -term target of at least 15%+.

Key Resistance Zone for Pepe – 39% Drop Ahead?Hello and greetings to all the crypto enthusiasts, ✌
In several of my previous analyses, I have accurately identified and hit all of the gain targets. In this analysis, I aim to provide you with a comprehensive overview of the future price potential for PEPE , 📚💡
The price of Pepe Meme Coin has been experiencing an atypical and sharp downtrend, approaching a critical monthly resistance zone. If this resistance fails to hold, we could face another substantial drop of approximately 39% , potentially bringing the price to the 0.00000500 level. This price point serves as a significant support area, historically acting as a strong defense against further declines. The outcome largely hinges on whether this support can withstand the selling pressure in the coming days. 📚🎇
🧨 Our team's main opinion is: 🧨
Meme Coin Pepe is facing a sharp drop and nearing a key resistance; if it breaks, we could see a 39% decline to the 0.00000500 support level, which has historically held strong. 📚🙌
Give me some energy !!
✨We invest countless hours researching opportunities and crafting valuable ideas. Your support means the world to us! If you have any questions, feel free to drop them in the comment box.
Cheers, Mad Whale. 🐋

Good luck PEPE$Alright, here’s how you can break it down for your audience:
🚨 PEPE/USDT Price Action Update 🚨
Right now, PEPE is forming a symmetrical triangle, which means price is squeezing tighter, getting ready for a breakout. The big question—which way?
What I’m Watching:
🔹 Key Resistance: Around 0.00001200, with a major hurdle at 0.00001800.
🔹 Key Support: Holding at 0.00000900, but if that breaks, we could see 0.00000800 next.
🔹 Volume is Low: Classic consolidation move—this means we’re waiting for a big spike in volume to confirm the next move.
Momentum Check 🔥
Right now, momentum is still weak (-19.63), but the selling pressure is starting to slow down. The TTM Squeeze shows the red bars fading, which could mean a shift is coming.
3 Scenarios to Watch
📈 Bullish Breakout: If we break above 0.00001000 with strong volume, next target is 0.00001200 and higher.
📉 Bearish Breakdown: If 0.00000900 fails, we could drop to 0.00000800 fast.
⏳ Sideways Chop: If we stay stuck between 0.00000900 - 0.00001000, the market is still undecided—waiting for a catalyst.
Game Plan:
✅ If we see a confirmed breakout with strong volume, I’ll look for entries on retests.
✅ If we break down, I’ll be watching for potential buys at key support levels.
✅ No rush—let’s wait for the market to tip its hand.
Stay sharp—big move coming soon! 🚀📉
This keeps it engaging, simple, and actionable. Let me know if you want any tweaks!

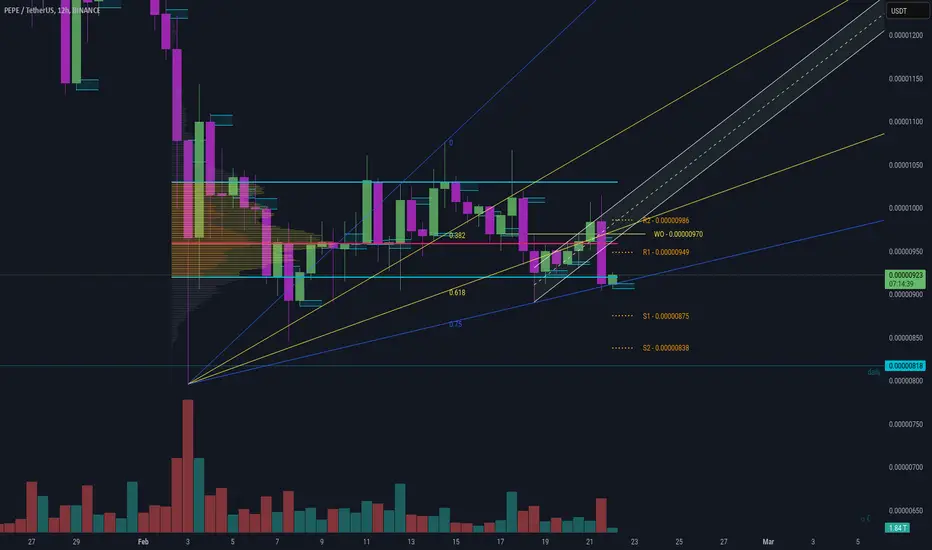
PEPE / USDT - Elliot Wave UpdatePEPE / USDT - Elliot Wave Update
Topic: Hit end of Wave 3 into 4
Left chart Macro Elliot Wave:
--------------------------------------
Pepe Elliott Wave 0-1-2-3-4-5 showing that (i believe) we've ended Wave 3 and probably in Wave 4. The 1.27 is an extension of 1 to 2 (debatable if that's correct).
End here is 3 to 4. 3 We've hit (I believe) 4 needs to be fulfilled.
To gauge 4 ending we pull Fib from the Top of Wave 2 down to the lowest low (end of wave 3 - our assumption).
This leaves fibs 0.236, 0.382, 0.5, and 0,618 as target highs to end Wave 4.
It's said that Wave 4 has equality of Wave 0 to 1. Which makes me believe that 0.5 or 0.618 are the target highs.
NOTE: Middle and Right chart coexist -> As in, the Gartley might not come down and therefore the CRAB Harmonic will kick in (what I'm saying is, don't wait for the price to come down to fulfill the gartley BUT also dont expect the price not to come down to fulfill the gartley, AND DON'T EXPECT EITHER TO HAPPEN. Risk management -> nothing certain, only probabilities).
Middle chart (Possible CRAB Harmonic):
--------------------------------------
Showing a demonstration (lets call it A) of the inner workings of Wave 4 playing out.
X to A resistance at 0.618 to form B.
Retrace to and between 0.382 to 0.888 to form C
C to D 1.618 which leads to a possible (probable) end of Wave 4 at 0.5.
Right chart (Possible Gartley Harmonic):
----------------------------------------
X to A = B 0.618
B to C 0.618 to 0.888
POSSIBLY to D as noted in NOTE above.
OR continuation of CRAB harmonic.
I've put probable buys and sell areas as guidance to my thoughts. Trade safe and if I've forgotten anything I wanted to articulate I'll update.
For me a learning exercise. Things only make sense the more data you have.
Knowledge base:
ChartChampions - None other than Daniel and his Team to learn from!
Book wise atm: JARROD SANDERS - Elliott Wave FIBONACCI HIGH PROBABILITY TRADING
Oh and definitely think that this was an extended Wave 3! I got suckered thinking I knew the levels without waiting and being patient before taking a trade! Patience and risk management for me is half the story! I know my levels but I'm a losing trader because I don't have patience. <3

Pepe - Parallel Chanel Local Monthly Feb RangeThe only thing I can come up with other than a "Magic Pill" is to follow the trend. Follow the short term trend.
Based on this analysis:

Pepe Fibs 0.5 technical's from way way back :) As can be seen sometimes fibs can be drawn from way back. 0.5. Finding support.

Pepe -- Why I'm all In!Speed fan Resistance 0.75 support! :) Massive. Guys, trust me, you dont want to not be in right now. Hold :) .
Pepe Resistance v SupportAnchored vWap from last highest high as resistance. Support Speed Fan Resistance 0.75 Simple. An point of Control

Pepe Volume ProfilesPepe Volume Profiles from beginning of time to now and volume profile from Last low to highest high.

Pepe - Bullish - Trend based fib levelsTrend based fib levels from previous lowest low to high to low (current).
2.0 extension and value area high from range pulled
Note: doesn't mean we cant go lower. Trade with caution!

Pepe USDT Day Trading Idea 1 March 2025Pepe USDT Day Trading Idea
Fib drawn from high to low of the rane were currently in. Obvious rejectioon at 0.5 and forming a Triangle Pattern if you will.
Day idea 1:
Possible 0.236 support with monthly as a backup at that level or S1 at 0.0000748. Trend reversal from suppoort with a possible high between 0.382 and 0.888 or R1 at 0.0000838. If S1 is hit be aware of the monthly being resistance at 0.236.
Day idea 2:
Possible S2 at 0.0000703 which fulfills the larger range Butterfly Gartley depicted in previous post posted here for reference.
For S and R levels I'm using the "Day Trading Booster BY DGT". Great indicator for day trading levels.
Pepe Guess the Trend BullishHey guys, for fun and in a way, I think it's always to get in on a move early. Up trend channel with supports on weekly.
Now yes I'm sure the same can be drawn from top down. I think it's important when trading not to get stuck on what you know or thin you know.
Always searching and not thinking you know what will happen is a good thing. AKA because no one knows. You only know what you know based on the data.
For example: Here after drawing the channel I can see that there is a weekly support at the bottom of the channel. Probable, support for higher momentum.
This way we're not blindly using Valid Chart patterns such as descending channels, triangles, etc but using levels we're aware of to make the best of them. Ultimately giving us the ability to make the best probable trade.

Pepe Triangle ResistanceHey guys, be away of the triangle resistance on pepe . Trade cautiously <3
This idea correlated with the recent ideas:
and:

Pepe Bearish Bat Harmonic BUT into a Bullish Gartley with FibExThis might blow our minds.
Bearish BAT Harmonic to 0.5 playing out to possibly the red C wave retracement 0.382 BUT at the same time being the 0.618 from X to A leading into a bullish Gartley! Bullish gartley B to C can reject at 0.382, 0.5, 0.618 or 0.888 depicted is at 0.618. For a retracement back to a D.
Fib retracement from X to A to D gives a high range of the Butterfly Harmonic posted here:
This corresponds with BTCUSDT Gartley Harmonic which gave me this idea posted here:
Just an idea as it's very early but its an idea! So to be clear, the Bat Gartley (RED) needs to play out first before the Gartley Harmonic (Green) plays out.
Happy trading, trade with risk management and all that.

SellPrice form drop base drop and it is now going to our base let keep watching and sel when it is there

Key Resistance Zone for Pepe – 40% Drop Ahead?Hello and greetings to all the crypto enthusiasts, ✌
All previous targets were nailed ✅! Now, let’s dive into a full analysis of the upcoming price potential for Pepe 🔍📈.
Pepe Meme Coin is experiencing an unusual sharp downtrend, approaching a critical monthly resistance zone. If this level breaks, the price could drop another 40% to the 0.00000400 support area, which has historically acted as strong defense. The key question now is whether this support can withstand the selling pressure in the coming days.📚🙌
🧨 Our team's main opinion is: 🧨
Pepe Meme Coin is in a sharp downtrend, facing key resistance, with a potential 40% drop if support at 0.00000400 fails. 📚🎇
Give me some energy !!
✨We invest hours crafting valuable ideas, and your support means everything—feel free to ask questions in the comments! 😊💬
Cheers, Mad Whale. 🐋

Breaking: The $PEPE X Account Has Been CompromiseThe CRYPTOCAP:PEPE team took to their telegram community to announced that the official X (Formerly Twitter) account has been compromise. Needless to say that the token was already down 3.54% as of the time of writing. With the RSI sitting at 36 more selling pressure could surmount.
What Is PEPE?
PEPE is a deflationary memecoin launched on Ethereum. The cryptocurrency was created as a tribute to the Pepe the Frog internet meme, created by Matt Furie, which gained popularity in the early 2000s.
The project aims to capitalize on the popularity of meme coins, like Shiba Inu and Dogecoin, and strives to establish itself as one of the top meme-based cryptocurrencies. PEPE appeals to the cryptocurrency community by instituting a no-tax policy and being up-front about its lack of utility, keeping things pure and simple as a memecoin
Pepe Price Live Data
The live Pepe price today is $0.000007 USD with a 24-hour trading volume of $454,987,385 USD. We update our PEPE to USD price in real-time. Pepe is down 4.22% in the last 24 hours, with a live market cap of $2,861,929,455 USD. It has a circulating supply of 420,689,899,653,544 PEPE coins and a max. supply of 420,690,000,000,000 PEPE coins.

PEPE BUY (UPDATE)hello friends
Considering the recent drop, the price has now returned well and it can be said that buyers are coming in little by little...
Now we have identified the good support points for you, which you can buy stepwise and with capital management.
*Trade safely with us*

PEPE UPDATE : AGAIN BUYhello friends
Due to the fall of this currency, we are now at the price floor and good conditions have been provided for buying, of course, with capital and risk management...
*Trade safely with us*

Lingrid | PEPEUSDT the "Dead Cat Bounce" in the MarketsThe price perfectly fulfilled my previous idea . It reached the target. BINANCE:PEPEUSDT market initially took liquidity above the range zone before pulling back and making a lower low. The entire crypto market appears to be experiencing a "dead cat bounce." On the monthly timeframe, the price formed a significant bearish candle, indicating a potential further downward move. I think that the price will retest the middle of the range zone, as it often acts as a support or resistance level and then push lower September low. My goal is support zone around 0.00000585
Traders, if you liked this idea or if you have your own opinion about it, write in the comments. I will be glad 👩💻

Pepe Butterfly Gartley UpdateHey guys, Pepe Butterfly Gartley just hit the target low at (D) which is now extended to 1.618 if the target is probably hit.
For S and R levels I'm using the "Day Trading Booster BY DGT". Great indicator for day trading levels.
Target high on D retracement back to (A) top of the range.
This is an update that originally started here:
This idea also goes with my posted idea "Pepe USDT Day Trading Idea 1 March 2025".
