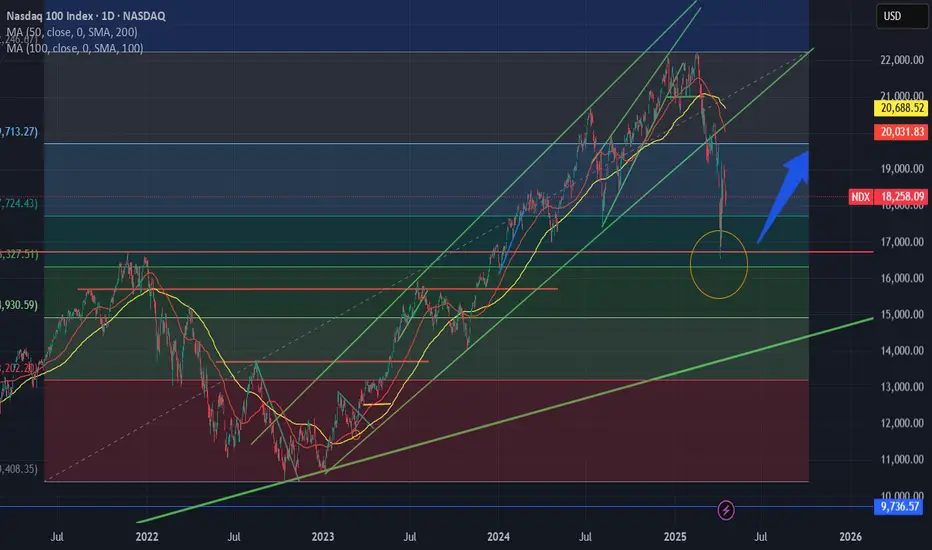
Definite downward trend. Great buying potential in near future.Hello all traders and learner charters. As you can see definite downward trend.
Some are even saying sell everything.
I added the five year percentages, as you can see its not very promising for the moment,
but definitely promising for anyone wanting to get into nasdaq or SP500.
There are seldom opportunities like this.
I would suggest to keep watching it, as a lot of people who rode the bull market after
Trump call, have taken there profits and sold. This trend will force others to sell as no one
wants to make a loss on nasdaq. So with that in mind, it will be red all over for a while I would say about two weeks maybe even more, but if you just keep on buying little amounts
DCA dollar cost averaging, you will get some good buying positions down low. And then hold them for the next few years. This is a great opportunity. Good luck.
NAS100 trade ideas

NASDAQ Decision making becomes easy after seeing this chart.NASDAQ (NDX) is currently on the 3rd straight red month (1M candle), following the February High and subsequent sell-off due to the Trade War. This has been analyzed extensively in previous analyses and how the fundamental scene is only now starting to show some positive progress but still has a long way to go.
Technically though, the picture is very clear and favors long-term investing. The market has been trading within a Fibonacci Channel Up since the U.S. Housing Crisis in 2008 and along with the 2022 Inflation Crisis, those have been the only real Bear Cycle events in the past 18 years.
In between those there have been another 5 shorter term corrections, that offered great buying opportunities for the long-term and the recent 3-month one classifies as one.
There reasons are three. First it has come very close to the 1M MA50 (blue trend-line), which only broke during the Major Corrections. Second, the 1M RSI hit the 50.50 Symmetrical Support, which has held during all those 5 prior Minor Corrections. Third, those corrections only range between two Fibonacci levels.
The current correction fulfills all those conditions. And since the 'weakest' rally we've have on this 5 event sample has been +37.57% and the strongest +96.77%, we have a medium-term Target on Nasdaq at 22800 and a long-term one at 32500.
Do you still reserve doubts at investing long-term after seeing this macro chart?
-------------------------------------------------------------------------------
** Please LIKE 👍, FOLLOW ✅, SHARE 🙌 and COMMENT ✍ if you enjoy this idea! Also share your ideas and charts in the comments section below! This is best way to keep it relevant, support us, keep the content here free and allow the idea to reach as many people as possible. **
-------------------------------------------------------------------------------
💸💸💸💸💸💸
👇 👇 👇 👇 👇 👇

Hanzo | Nas100 15 min Breaks – Will Confirm the Next Move🆚 Nas100 – Hanzo’s Strike Setup
🔥 Timeframe: 15-Minute (15M)
———————
💯 Main Focus: Bullish Breakout at 18160
We are watching this zone closely.
📌 If price breaks with high volume, it confirms Smart Money is in control, and a strong move may follow.
💯 Main Focus: Bearish Breakout at 18000
We are watching this zone closely.
📌 If price breaks with high volume, it confirms Smart Money is in control, and a strong move may follow.
———
🔻 Every warrior needs a tribe.
Follow Hanzo. Support the path.
Analysis
👌 Bearish Signs (15M TF):
• Liquidity Grab + CHoCH at 18700
• Liquidity Grab + CHoCH at 18400
• Strong Rejections seen at:
➗ 18400 – Major support
➗ 19000 – Proven resistance
———
🩸 Key Zones to Watch:
• 18700 – Bearish breakout level
• 19130 – Strong resistance (tested 6 times)
• 18400 – Equal lows

US100 21.04.2025+US Leading Index Miss
+COT Bearish
~+General gloomy sentiment about tariffs, Fed's independence & trade talks with Japan
~-thin volumes after holidays


NAS100USD: Bearish Momentum Likely to Extend in NY SessionGreetings Traders!
At present, NAS100USD continues to reflect clear bearish institutional order flow. This is evidenced by the consistent formation of lower lows and the way bearish arrays—such as fair value gaps and order blocks—continue to hold as effective resistance zones.
Key Observations:
Sustained Bearish Structure:
The market has maintained a downward trajectory, with each rally being absorbed by bearish arrays. This behavior reinforces the dominance of institutional selling pressure.
High Volatility Window – New York Session:
With the New York session now underway, heightened volatility is expected. This presents a favorable environment for bearish continuation trades, particularly if price respects the key supply zones.
Trading Strategy:
Entry Consideration:
I am awaiting a retracement into a key bearish array—either a fair value gap or a bearish order block. Upon confirmation of rejection from these zones, I will seek to enter short positions.
Profit Targets:
The primary objective will be to target liquidity pools residing at lower discount levels. These areas represent external liquidity where institutional participants are likely to complete order execution.
By aligning with the prevailing bearish institutional narrative and waiting for high-probability confirmations within premium zones, we can strategically position ourselves to benefit from further downside momentum during this high-impact session.
Kind Regards,
The Architect

NAS100 - Will the stock market go bullish?!The index is trading below the EMA200 and EMA50 on the four-hour timeframe and is trading in its descending channel. If the index moves down towards the specified demand zone, one can look for the next Nasdaq long positions with a good risk-reward ratio.
Economists remain divided over whether President Donald Trump’s tariff policies are weakening the economy enough to trigger a recession. Some believe the possibility of a recession is significant, citing the rising costs of tariffs that are burdening both businesses and consumers. Others argue that the U.S. economy is strong enough to weather the trade war without falling into recession, pointing to resilient employment levels and consumer spending.
Forecasting experts also express differing views regarding the risk that Trump’s tariff campaign could tip the economy into a downturn. A Wall Street Journal survey conducted in April among 57 economists revealed that, on average, participants estimated a 45% chance of a recession occurring within the next 12 months—up from just 20% in the January survey.
The economic outlook took a notable downturn in February, when Trump began announcing tariffs against key U.S. trading partners. Many forecasters, who had expected a “soft landing” from post-pandemic inflation, are now preparing for a possible recession, as these tariffs and other economic barriers are forcing both households and businesses to tighten spending.
A separate survey of financial professionals working with businesses found that many companies have recently faced greater difficulty in collecting payments from clients, indicating growing financial strain among key economic players. The Credit Managers’ Index, overseen by the National Association of Credit Management and monitored by economist Chris Kuehl, still showed growth in March, though at a slower pace than before.
On the more optimistic side is Allen Sinai from Decision Economics, who assigns only a 20% probability to a recession within the next year. Although this is an increase from his January estimate of 10%, he still considers it an unlikely scenario.
Sinai’s primary reason for optimism is the strength of the labor market, which has remained stable since recovering from the massive layoffs during the COVID-19 lockdowns. March’s unemployment rate was 4.2%—close to historic lows—and not indicative of an economy in recession.
One major point of disagreement between recession pessimists and optimists lies in the interpretation of consumer sentiment data. Surveys have shown that people are increasingly worried about inflation, the job market, and their personal finances. If such concerns lead to more cautious consumer spending, it could weigh heavily on the overall economy.
The upcoming week is expected to begin quietly in terms of economic data releases, particularly due to global markets being closed on Monday in observance of Easter. However, midweek brings key reports that could significantly influence market expectations. On Wednesday, the preliminary S&P Global composite purchasing managers’ index for April and March new home sales figures are due. Thursday will feature a packed slate of indicators, including durable goods orders, jobless claims, existing home sales, and the final reading of the University of Michigan’s consumer sentiment index.
Alongside the data releases, investors will closely monitor remarks from Federal Reserve officials. Following Jerome Powell’s firm stance last week, upcoming speeches by Kashkari, Goolsbee, and Harker could shape or reinforce market expectations regarding the Fed’s future policy path.
Meanwhile, Apple is grappling with mounting challenges in the global marketplace. In China, the company has lost a significant portion of its market share, with sales declining by 9%, while Huawei’s sales have grown by 10%, and Xiaomi now holds the top spot with an 18.6% market share. These shifts reflect a notable pivot in Chinese consumer preferences toward domestic brands. Furthermore, U.S.-imposed tariffs on Chinese goods have put additional pressure on Apple’s profit margins in its home market, placing the company in a tough position.

Sell nas100 to double bottom*I am in no way a financial advisor and you should always do your own due diligence before placing any trade. Do not trade what you are not comfortable with losing. No trade is guaranteed.
SL 18,241
TP 16,150

NAS100 Testing Lows: Will a Bounce Offer a Sell Opportunity?NAS100 Technical & Fundamental Analysis 🧐
Overall Sentiment: The current market sentiment surrounding tech stocks and the broader indices like the NASDAQ 100 appears cautious, leaning bearish. Factors like persistent inflation concerns, uncertainty around the Federal Reserve's future interest rate path 🏦, and ongoing geopolitical tensions can weigh heavily on growth-sensitive assets like tech stocks. Keep an eye on upcoming economic data releases (CPI, PPI, FOMC minutes) as they could significantly sway sentiment.
1. Daily Timeframe (D1): The Bigger Picture 🗺️
The NAS100 is exhibiting clear bearish characteristics on the daily chart, forming lower highs and lower lows.
Price is currently approaching or testing a significant area of previous daily equal lows. This is a critical zone ⚠️. Why? Because significant buy-side liquidity often rests below such lows (in the form of stop-loss orders from long positions) and sell-side orders may trigger if these levels break decisively.
A strong break and close below these daily lows could signal a continuation of the major downtrend, potentially accelerating selling pressure. Conversely, this area could act as temporary support, prompting the pullback you're anticipating.
2. 4-Hour Timeframe (H4): The Setup Structure 🏗️
My H4 chart clearly illustrates the recent sharp decline. Price is currently testing the support zone highlighted (around 17,800 - 18,000), which corresponds to the 0.00% Fibonacci level (17,973.8) drawn from the recent swing high (~19,117.4).
This support zone aligns with the concept of hitting the daily lows/liquidity area.
Anticipated Scenario:
I am expecting a reaction (a bounce/pullback) from this current zone. The projected path suggests a retracement towards the 50% Fibonacci level (Equilibrium) at approximately 18,547.3. This level often acts as significant resistance after a strong impulse move. The 61.8% level (~18,682.6) is also a key area to watch just above it.
Point of Interest (POI):
The zone between the 50% and 61.8% Fib levels (roughly 18,550 - 18,700) is your key decision area for a potential short entry. 👍
3. 15-Minute Timeframe (M15):
Entry Confirmation Trigger 🔫
The M15 timeframe will be crucial if price reaches your H4 POI (around the 50% Fib level).
What to Look For: During the potential pullback towards ~18,550, the M15 will likely show a temporary bullish structure (higher highs and higher lows).
Confirmation Signal:
For your short setup, you'd want to see this M15 bullish structure fail upon reaching the H4 resistance zone. Look for:
A break of market structure (BOS) to the downside on M15 (price making a lower low after failing to make a higher high).
Formation of clear M15 lower highs and lower lows.
Bearish candlestick patterns (e.g., engulfing candles, pin bars/shooting stars) rejecting the H4 resistance/Fib level.
Potential divergence on indicators like RSI or MACD (though price action is primary).
Synthesized Outlook & Strategy:
The NAS100 is undeniably in a bearish phase across multiple timeframes. The current test of daily lows / H4 support (~17,973) is a critical juncture. A bounce from here seems plausible, aligning with your expectation of a pullback.
The Strategy:
Patience: Wait for price to potentially rally towards the H4 50%-61.8% Fibonacci retracement zone (~18,547 - ~18,682). 🧘♀️
Confirmation:
Monitor the M15 timeframe closely as price approaches this zone. Look for a clear shift in market structure from bullish (pullback) to bearish (resumption of trend). 📉
Entry: If bearish confirmation occurs (M15 BOS), consider a short entry.
Targets:
Initial targets could be the recent lows (~17,973), followed by the Fibonacci extension levels shown on your chart (e.g., -50% at ~17,400.4) or the area below the daily equal lows. 🎯
Risk Management: Crucially, define your stop-loss level (e.g., above the swing high formed during the M15 structure break or above the 61.8%/78.6% Fib level) to manage risk effectively. 🛡️
Fundamental Check:
cross-reference this technical setup with any major news releases or shifts in market sentiment that could invalidate the pattern. 📰

NAS100USD: Bearish Continuation After FVG RebalanceGreetings Traders!
In today’s analysis of NAS100USD, the institutional order flow remains bearish, continuing the momentum established during last week’s trading sessions. In alignment with this directional bias, we are strategically focused on identifying high-probability bearish opportunities.
KEY OBSERVATIONS:
Sustained Bearish Order Flow:
Institutional behavior continues to reflect a bearish narrative, suggesting that smart money remains committed to driving price lower.
Rebalancing a Fair Value Gap (FVG):
Price is currently rebalancing a notable fair value gap—an internal range inefficiency—providing the perfect confluence zone for bearish setups. This rebalancing typically precedes a draw on external liquidity.
Targeting External Range Liquidity:
As the market rebalances internal inefficiencies (FVGs, order blocks), it subsequently seeks external range liquidity such as sell stops, liquidity pools, and engineered lows. This is a fundamental principle of institutional price delivery.
TRADING PLAN:
Entry Consideration:
Monitor price action within the fair value gap for confirmation of bearish intent. This zone serves as an internal liquidity area, optimal for institutional order execution.
Profit Targets:
Focus on external liquidity resting below previous lows—particularly sell stops and liquidity pools. These levels represent the logical draw where institutions aim to finalize order pairing and take profit.
By following the institutional flow, we align ourselves with smart money practices, improving our precision and probability of success. Stay patient and disciplined—confirmation is key!
Its good to be back,
The_Architect


NQ for the weeki don't see a lot of options for shorters here if you didn't catch the move, possibly you can you get some short in lower time frame toward that ray i pointed out there, some options if you want to buy is wait for that thursday low get taken and patiently wait for a reversal. IF today have been this volatile, i don't suggest to trade tomorrow.

Will Nasdaq Test Liquidity at 17,800 Before an Upside Move?NASDAQ is experiencing bearish slow down at the support level for the past 3 weeks. A re-test of the recent low looks imminent. and if price could be rejected after clearing H4 liquidity at 17,800, then we could see a sharp upside move.
Key risks: Fed commentary, major tech earnings, and geopolitical headlines.
N.B!
- NASDAQ price might not follow the drawn lines . Actual price movements may likely differ from the forecast.
- Let emotions and sentiments work for you
- ALWAYS Use Proper Risk Management In Your Trades
#nq!
#nasdaq

2800+ Possibly on NASDAQWhether white house presser or TRUMP go to China again, Japan or Ukraine,,,,,,,i am not interested but waiting for Nasdaq stock to reach 17,377 price level, even i am offline my spirit / broker would do the needful
1:6 RR is worth waiting for

Bearish opportunity if support is broken📉 US100 – Watching for a possible bearish breakout
After reaching the key level of 19,151.5, the US100 price has shown weakness by breaking out of an ascending wedge. It is currently testing a dynamic support zone at 18,695.4, just before a liquidity zone marked in red.
A break below this zone could trigger a move towards 18,434.1, and in extension towards 18,185.8, if bearish pressure continues.
This structure suggests that momentum is shifting in favor of the bears, especially if the blue support fails to sustain the price.
🧠 Action plan: Monitor a breakout with volume and a bearish structure to seek short entries with appropriate risk management.

Choose your Side- i often compare TheKing with Nasdaq right now.
- Have a main reason :
- NAS100 (Nasdaq) have mostly "Top Tech Companies" acting as Thermometers in this index.
- SPX (SP500) have Tech Companies + traditional ones. Nasdaq Companies are also included in SPX, but 500 Companies start to be a lot.
- DJIA (Dow Jones Industrial Average) is a Mastodons, i don't use it much because this top 30 is too mixed ( coca cola, boeing, techs, big banks, nike.. etc).
- i mostly use very high TFs, i prefer look from far, less noise, more easy and less headaches.
- i use sometimes to trade with 1D, H12, H4 TFs but when we are bullish. In bearmarket, it's hard to find entries points in bearish mode.
- i don't short markets and accumulate more coins/tokens, so i just DCA, Dollar Cost Averaging is investing a fixed amount of money into a particular investment at regular intervals.
- so this chart is basically only about MACD :
- it's really interesting to see Nasdaq making another red columns in 3W TF, while the markets should recover slowly.
- if you take a look at BTC, columns stayed in Light Red Color and reducing size.
What could it means ?
- Keep in mind that BTC is not a STOCK.
- One of the most pivotal events on Bitcoin's blockchain is the halving, when the supply of new bitcoins is cut in half (2024).
- BTC have 21M Supplies and that's all. no more will be created.
- At any time BTC could stop to follow Nasdaq and do his way, TheKing used to do that before already.
- A small bounce in Nasdaq could be also a huge move for BTC.
- " Choose your side " and DCA the money you don't need for living.
Happy Tr4Ding !

What is ICT Order Block and How to Trade it
👉🏻 ICT order block is basically an area on the price chart which indicates the huge institutional orders and signals the strong reversal or continuation of price.
You can use the order block as a confirmation of your trade entry or for the reversal of price.
In this article, we will teach you all about order block trading strategy from definition to its identification and to use along with examples.
You can jump to the part of this guide, you are most interested in or you can continue reading the whole article :
Table of Contents 👇🏻
1 : What is ICT Order Block?
2 : Types of Order Block
3 : Bullish Order Block
4 : Bearish Order Block
5 : Bullish Order Block Trading Strategy
6 : Bearish Order Block Trading Strategy
7 : Final Thoughts
What is ICT Order Block? ⚡️
ICT Order block is the area in the price chart, where a large number of orders are executed by institutional traders in the market and market shows sudden strong move from that area.
Retail traders follow institutional foot prints, so they wait for these order block zones to buy or sell in the market & make profit along with big institutions like banks.
You can see the example of order blocks in the picture given below :
Types of Order Block
As you know market has two price moves bullish & bearish. So on the basis of price moves, order block is divided into two types.
(I) Bullish Order Block
(II) Bearish Order Block
Bullish Order Block
A bullish order block is the last bearish candle before the bullish impulse (strong sudden) move, it typically consist of two candles, with the first candlestick being a bearish and the second candlestick being a bullish one.
How to Identify a Bullish Order Block? ⚡️
To identify a valid bullish order block you need to check following things.
(I) Second candle being a bullish candle, should grab the low of previous bearish candle. Price should go below the low of previous bearish candle.
(II) Second candle being a Bullish candle should close above the high of previous bearish candle.
(III) Imbalance in lower time frame in the order block zone.
(IV) Structure shift in lower timeframe.
To sum it up we can say, second candle should completely engulf the first candle – body to body & wick to wick.
You can see the example of bullish order block in the picture below :
Bearish Order Block ⚡️
A bearish order block is the last bullish candle before the bearish impulse move, it typically consist of two candles, with the first candlestick being a bullish and the second candlestick being a bearish one.
How to Identify a Bearish Order Block? ⚡️
To identify a valid bearish order block you need to check following things.
(I) Second candle being a bearish candle, should grab the high of previous bullish candle. Price should go above the high of previous bearish candle.
(II) Second candle being a bearish candle should close below the low of previous bullish candle.
(III) Imbalance in lower timeframe in the order block zone.
(IV) ICT Market Structure Shift in lower timeframe.
To sum it up we can say second candle should completely engulf the first candle – body to body & wick to wick.
You can see the example of bearish order block in the picture below :
Bullish Order Block Trading Strategy ⚡️
In bullish order block trading strategy you would look for shift of price delivery from bearish to bullish and then execute a buy trade utilizing a bullish order block.
When the trend is bearish and it approaches a demand zone where you would seek reversal of price and at that area price shifts its structure to the buy-side.
Then you will be looking for the order block at the bottom of the impulse move which changed market trend.
When you find the bullish order block in that move, it means it was a move involving institutions so you need to wait for the price to test the bullish order block zone to execute a buy trade.
When price retraces back and tests the bullish order block zone you can execute a buy trade as shown in the picture below :
When tradin bullish Order block trading strategy your stop loss will be 10/20 pips below the low of order block zone.
Bearish Order Block Trading Strategy ⚡️
In bearish order block trading strategy you would be looking for the shift of trend from bullish to bearish and then execute a sell trade utilizing a bearish order block.
When market trend is bullish and it approaches a supply zone where you seek reversal of price and at that area price shifts its structure to the sell-side.
Then you would look for the order block at the bottom of the impulse move which changed price trend.
When you find a bearish order block in that move it means it was a move involving institutions so you need to wait for the price to test the bearish order block zone to execute a sell trade.
When price retrace back and tests the bearish order block zone you can execute a sell trade.
A real market example of bearish order block trading strategy is shown below in the picture.
Final Thoughts⚡️
When trading using bearish Order block trading strategy our stop loss will be 10/20 pips above the high of order block zone.
Order blocks can also be found in a trend after a pull back and these order blocks confirm the strength of trend. We can use these order blocks to trade the trend or to add new positions in the trend.
Like in a bearish trend after a bullish pullback a bearish order block may form, which confirms the strength of bearish trend and we can add a new sell order to enjoy the bearish trend.
Likewise in a bullish trend after a bearish pullback a bullish Order block may form which confirms the strength of bullish trend and we can add a new buy order to enjoy the bullish trend ❤️ .

Consolidating at lower levels, gathering strength for a rebound(The following is solely a personal opinion and does not constitute investment advice. Please exercise your own judgment before making any decisions.)
Due to the Easter long weekend, there were only four trading days last week. Despite the Trump administration's renewed escalation of U.S.-China tariffs and its threats of war against Iran, the Nasdaq remained largely range-bound over the week. Crude oil prices saw a modest increase, while gold experienced a stronger rally driven by rising risk-off sentiment.
Nasdaq Outlook:
After the market opens next Tuesday, the Nasdaq has a high probability of filling the price gap between 18,600 and 18,800. However, before the full impact of the tariff policy is priced in, the market may still test lower support levels.
Key downside support lies in the 17,000–17,300 range. If the market fails to find strong buying interest above this zone, prices may retest the previous low of 16,349, or even fall further toward the 15,500 level.
That said, the Nasdaq is currently in a deeply oversold condition on the daily chart. In the absence of further negative developments, there is a high likelihood of a significant rebound in the coming weeks. Next week may still require patience as the market digests the negative implications of the tariff news.

Downtrending Nasdaq is currently consolidating.Downtrending Nasdaq is currently consolidating waiting for signals to breaks 19200 Resistance

Nasdaq Big Move (Trump Tariff Pause Effect)yesterday S&P 500 did biggest reversal move since 2008,
its bullish sign for use stock, therefor smart money expecting to buy again ,
there for we are expecting sharp move on CPI event, where smart money will buy with big order for log next 90 days

Following weekly structureWeekly tf has giving a clear choch
H4 making LLs
Marked POI on the weekly for potensial downside
First we have to grab all liquidity created before we have a manupilation to the upside
Lets see hows this gonna play out in the next 2 weeks tops

Nasdaq - This Is Still Not The End Yet!Nasdaq ( TVC:NDQ ) cannot resist bearish pressure:
Click chart above to see the detailed analysis👆🏻
Over the past three months, we saw such a harsh correction on the Nasdaq that a lot of people are freaking out entirely. However technicals already told us that something feels wrong and this is the result. If we see another -10% from here, buying the dip will most likely pay off.
Levels to watch: $16.000
Keep your long term vision,
Philip (BasicTrading)

Long - assuming nothing else blows upThe recent drop seems to be due by policy that is still ambiguous and evolving, good chance trade war dies down when deals are made. other than that, NDX bounced off a previous high and has momentum to at least revert to the ma