Nasdaq-100 H4 | Falling toward a pullback supportThe Nasdaq-100 (NAS100) is falling towards a pullback support and could potentially bounce off this level to climb higher.
Buy entry is at 19,595.55 which is a pullback support.
Stop loss is at 18,900.00 which is a level that lies underneath an overlap support.
Take profit is at 20,343.35 which is a swing-high resistance.
High Risk Investment Warning
Trading Forex/CFDs on margin carries a high level of risk and may not be suitable for all investors. Leverage can work against you.
Stratos Markets Limited (tradu.com):
CFDs are complex instruments and come with a high risk of losing money rapidly due to leverage. 63% of retail investor accounts lose money when trading CFDs with this provider. You should consider whether you understand how CFDs work and whether you can afford to take the high risk of losing your money.
Stratos Europe Ltd (tradu.com):
CFDs are complex instruments and come with a high risk of losing money rapidly due to leverage. 63% of retail investor accounts lose money when trading CFDs with this provider. You should consider whether you understand how CFDs work and whether you can afford to take the high risk of losing your money.
Stratos Global LLC (tradu.com):
Losses can exceed deposits.
Please be advised that the information presented on TradingView is provided to Tradu (‘Company’, ‘we’) by a third-party provider (‘TFA Global Pte Ltd’). Please be reminded that you are solely responsible for the trading decisions on your account. There is a very high degree of risk involved in trading. Any information and/or content is intended entirely for research, educational and informational purposes only and does not constitute investment or consultation advice or investment strategy. The information is not tailored to the investment needs of any specific person and therefore does not involve a consideration of any of the investment objectives, financial situation or needs of any viewer that may receive it. Kindly also note that past performance is not a reliable indicator of future results. Actual results may differ materially from those anticipated in forward-looking or past performance statements. We assume no liability as to the accuracy or completeness of any of the information and/or content provided herein and the Company cannot be held responsible for any omission, mistake nor for any loss or damage including without limitation to any loss of profit which may arise from reliance on any information supplied by TFA Global Pte Ltd.
The speaker(s) is neither an employee, agent nor representative of Tradu and is therefore acting independently. The opinions given are their own, constitute general market commentary, and do not constitute the opinion or advice of Tradu or any form of personal or investment advice. Tradu neither endorses nor guarantees offerings of third-party speakers, nor is Tradu responsible for the content, veracity or opinions of third-party speakers, presenters or participants.
NAS100 trade ideas

Technical and digital analysisWe notice that we are in an upward correction and there is an increase in momentum. We are waiting for sellers to weaken in order to buy

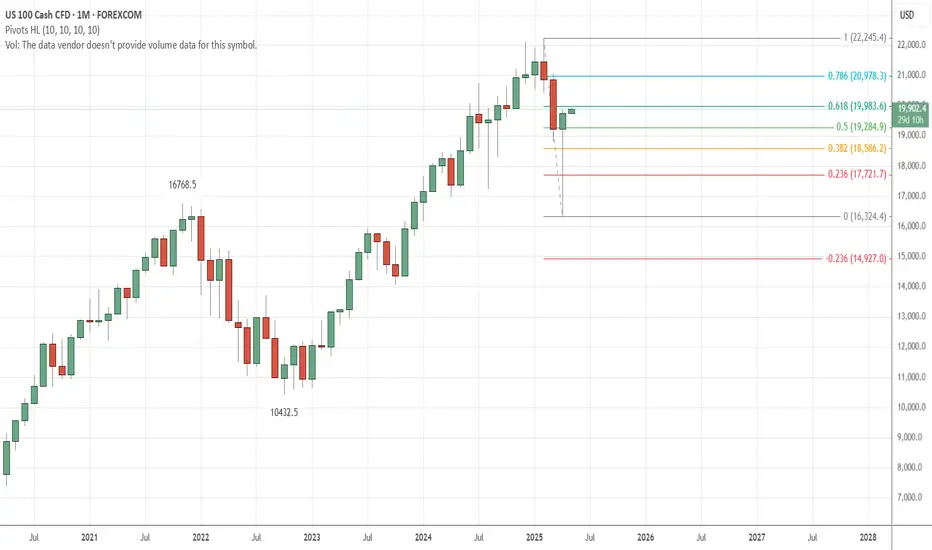
NQ: Unexpected bullish Monthly close!NQ Monthly candle was bullish! Price retraced up to 61.8 fib. From this TF, we should expect a continuation up!!
This is against my weekly analysis that projected 5 down waves and price has reached the end of Wave 2.
Let see how it works out.
SHORT ON NAS100Nice Double Top on NAS at a major resistance level.
I will be selling nas to the next demand level for 2000-3000 points.

Bullish bounce?NAS100 is falling towards the support level which is an overlap support that is slightly above the 38.2% Fibonacci retracement and could bounce from this level to our take profit.
Entry: 18,908.67
Why we like it:
There is an overlap support level that is slightly above the 38.2% Fibonacci retracement.
Stop loss: 18,461.05
Why we like it:
There is an overlap support that lines up with the 50% Fibonacci retracement.
Take profit: 20,200.53
Why we like it:
There is an overlap resistance level that is slightly above the 161.8% Fibonacci extension.
Enjoying your TradingView experience? Review us!
Please be advised that the information presented on TradingView is provided to Vantage (‘Vantage Global Limited’, ‘we’) by a third-party provider (‘Everest Fortune Group’). Please be reminded that you are solely responsible for the trading decisions on your account. There is a very high degree of risk involved in trading. Any information and/or content is intended entirely for research, educational and informational purposes only and does not constitute investment or consultation advice or investment strategy. The information is not tailored to the investment needs of any specific person and therefore does not involve a consideration of any of the investment objectives, financial situation or needs of any viewer that may receive it. Kindly also note that past performance is not a reliable indicator of future results. Actual results may differ materially from those anticipated in forward-looking or past performance statements. We assume no liability as to the accuracy or completeness of any of the information and/or content provided herein and the Company cannot be held responsible for any omission, mistake nor for any loss or damage including without limitation to any loss of profit which may arise from reliance on any information supplied by Everest Fortune Group.

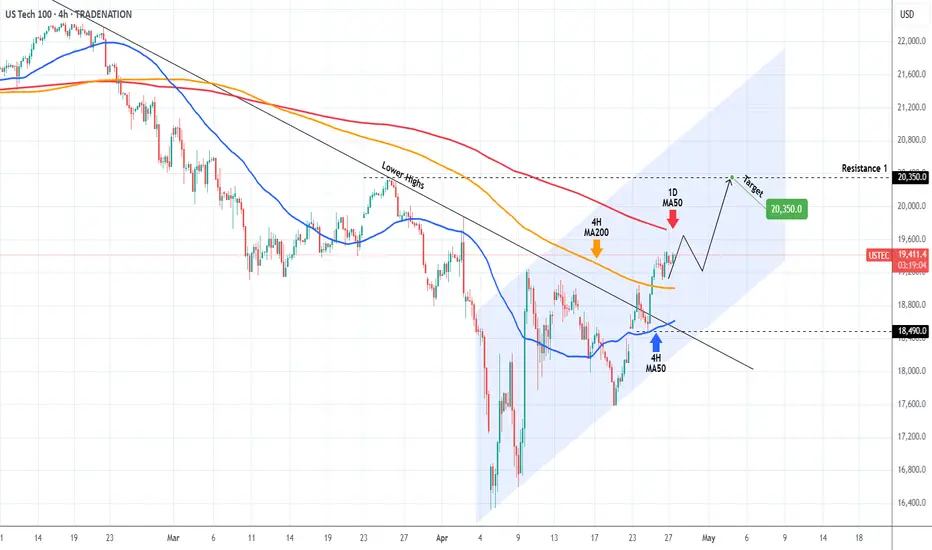
NASDAQ ahead of the most critical Resistance test.Nasdaq (NDX) not only broke above the Lower Highs trend-line of its All Time High (ATH) last week but managed to break and turn the 4H MA200 (orange trend-line) into Support.
It is now aiming for the 1D MA50 (red trend-line), which is the most crucial Resistance level of this recovery attempt and is what technically turns bearish trends into bullish if it turns into Support.
We expect a short-term rejection there, which should give a buy opportunity near the 4H MA200. Our Target for this is 20350 (Resistance 1).
-------------------------------------------------------------------------------
** Please LIKE 👍, FOLLOW ✅, SHARE 🙌 and COMMENT ✍ if you enjoy this idea! Also share your ideas and charts in the comments section below! This is best way to keep it relevant, support us, keep the content here free and allow the idea to reach as many people as possible. **
-------------------------------------------------------------------------------
Disclosure: I am part of Trade Nation's Influencer program and receive a monthly fee for using their TradingView charts in my analysis.
💸💸💸💸💸💸
👇 👇 👇 👇 👇 👇
Nas100 Diamond BottomAt the 16400 gap down the play was simple, buy, fill the gap and bullish engulf this puppy.
So it happened, and the 10 percent pump is the middle of the diamond. Then what was left to be bullish on the final retraces onto the right side of the diamond.
Now we are in. I expect exponentiaal growth, but first target is the magic average plotted on this chart.
Good luck and remember, no guarantees. I play the chart and trust it, but if it backfires thats my risk im willing to take.

US100 - Corrective Pullback into FVG + Golden Pocket setup?This 1H Nasdaq chart paints a classic structure of retracement within a bullish leg, offering potential for continuation after a clean corrective move into inefficiency. It's all about balance restoration before the next impulse.
---
1. Resistance Reaction & Local Distribution
Price faced strong rejection at a clearly defined Resistance Zone , marking a point of supply where sellers stepped in with aggression.
- The sharp rejection indicates profit-taking from earlier longs or a short-term distribution zone.
- Structure is transitioning from impulsive to corrective, suggesting a pullback is unfolding rather than a trend reversal (at least for now).
---
2. Short-Term Demand Zone Holding Price (Gray Box)
Before reaching deeper liquidity, price is hovering above a local demand block —a previously unmitigated consolidation that supported the last push up.
- This gray zone may provide temporary support, but lacks depth of imbalance.
- It's a weak floor, and smart money typically seeks deeper fills for proper re-accumulation.
---
3. Fair Value Gap Below (Primary Draw on Liquidity)
The key area of interest lies just below, where a clean Fair Value Gap (FVG) is formed. This imbalance represents a void in price action where buy-side inefficiency remains.
- Aligned with the 0.618–0.65 Fibonacci retracement range (confluence entry).
- Price is likely to seek this inefficiency for proper rebalancing.
- It’s not just a “fill the gap” play—it’s a liquidity grab where smart money is most likely waiting.
This zone is ideal for reaccumulation before resuming the move higher.
---
4. Internal Structure Suggests Bullish Intent After Fill
Price is forecasted to:
- Step 1: Break beneath the short-term demand to draw in liquidity
- Step 2: Tag the FVG zone, tapping into fresh demand
- Step 3: Shift structure via higher low formation and breakout
This is the behavior of an engineered retracement—not panic selling.
---
5. Macro Bias Still Bullish – Controlled Pullback
While the short-term price action looks bearish, the context remains supportive of upward continuation:
- No signs of aggressive selling below structure
- Current flow is corrective, not distributive
- FVG zone is strategically placed in alignment with optimal trade entry levels (OTE)
If this zone holds, expect a return to bullish expansion targeting inefficiencies left behind on the push down.
---
Conclusion:
This setup is textbook:
- Efficient rejection at resistance
- Controlled retracement into FVG with Fibonacci confluence
- Potential structural shift post-rebalance
Watch for bullish intent to return once the imbalance is filled. Until then, this is not a breakdown—it's a setup.

NAS100 BUY Trade ideiaNAS100 Long move trade ideia. Expecting to see trade reach this target.
Please move SL to BE once it hits 1-1RR.

US100 Locking as Bullish directionUS00 Structure Looking as strong Bullish Pattern,
Forecast from Mr Martin Date 02 May 2025,
US100 Price will looking as buy side recently price will break and catch the support after push to buy side the bullish structure continue to play out the next project would be a clean rally toward the top of the channel US100 is holding its bullish structure well,
Key Level to watch
Resistance level 20,500 / 21,000
Support Levels 19,500
you can find more details in the chart of you find this idea help or learned something new then leave comments Thanks for Regarding.

X2: NQ/US100/NAS100 Long - Day Trades 1:2X2:
Risking 1% to make 2%
NAS100, US100, NQ, NASDAQ Long for day trade, with my back testing of this strategy, it hits multiple possible take profits, manage your position accordingly.
Risking 1% to make 2%
Use proper risk management
Looks like good trade.
Lets monitor.
Use proper risk management.
Disclaimer: only idea, not advice

NAS100USD: Price Respects Bearish Structure at 62% FibGreetings Traders,
In today’s analysis on NAS100USD, we observe sustained bearish institutional order flow, and we aim to align with this directional bias by identifying high-probability selling opportunities.
KEY OBSERVATIONS:
1. Retracement into Premium Resistance:
Price has recently retraced into premium pricing levels, reaching the 62% Fibonacci retracement zone—a level that often acts as dynamic resistance. This retracement also aligned with a bearish breaker block, confirming institutional resistance at that level. The market has since shown signs of rejection, reinforcing the bearish narrative.
2. Emergence of Fair Value Gap (FVG) as a Key Resistance Array:
Following the rejection, a new FVG has formed, acting as a potential short-term resistance zone. This area provides a refined point of interest where institutions may look to re-engage in selling activity. The alignment of the FVG with previous resistance adds further confluence to the bearish setup.
TRADING PLAN:
We will monitor the newly formed FVG zone for signs of bearish confirmation. Upon confirmation, the plan is to execute short positions targeting liquidity pools in discounted price zones, in line with institutional price delivery patterns.
Remain focused, wait for confirmation, and make sure this idea aligns with your overall trading plan.
Kind Regards,
The Architect

Breakout or Rejection at Key ResistanceSupport and Resistance Levels:
Resistance: 19,856.6 is a key level where the price has recently been rejected.
Support: 19,146.4 is a major support, with an intermediate level at 19,516.0 acting as a pivot point.
Trend and Structure:
The price has broken a descending trendline (white dotted line), suggesting a potential trend reversal from bearish to bullish.
Currently, the price is consolidating between 19,516.0 and 19,856.6, indicating indecision.
Indicators:
EMA 200 (Daily): The price is below the EMA 200 (19,856.0), indicating that the long-term trend remains bearish until the price sustains above this level.
Fibonacci: The 138% / 50% Fibonacci retracement level (18,950.0) has acted as support in the recent past.
Bullish Scenario:
If the price breaks and holds above 19,516.0 with volume, it could target the resistance at 19,856.6.
A confirmed break above 19,856.6 (with a close above the EMA 200) could signal bullish momentum toward 20,000 or higher.
Bearish Scenario:
If the price fails to hold above 19,516.0 and breaks lower, the next key support is at 19,146.4.
A drop below 19,146.4 could push the price toward 18,950.0 (Fibonacci level).
Recommendation:
Long Entry: Wait for a confirmed break above 19,516.0 with a strong close and volume. Target: 19,856.6. Stop-loss below 19,400.0.
Short Entry: If the price rejects 19,516.0, consider a short with a target at 19,146.4. Stop-loss above 19,600.0.
Monitor volume and price action near the EMA 200 for trend confirmation.
Note: This analysis is for informational purposes only and not financial advice. Adjust based on your strategy and risk management.

NASDAQ SCENARIO 27/04/2025English : According to our analysis, we anticipate a BULLISHscenario.
Morocan Darija : kanchofo d'apres l'analyse dyalna antsanaw TLOO3
ATENTION : I only share my ideas, not signals

NAS100USD: Bullish Scalping Opportunity from SupportGreetings Traders,
In today’s analysis of NAS100USD, we identify bullish institutional order flow, and as such, we aim to align with this narrative by seeking buying opportunities.
This setup presents a scalping opportunity on the lower timeframes, with price currently reacting to a bullish order block serving as a key institutional support zone. Upon confirmation, we anticipate a move toward the liquidity pool in premium pricing, which will serve as our target zone for profit-taking.
As always, remain disciplined, wait for clear confirmation, and manage risk accordingly.
Kind Regards,
The Architect

X2: NQ/US100/NAS100 Long - Day Trades 1:2X2:
Risking 1% to make 2%
NAS100, US100, NQ, NASDAQ Long for day trade, with my back testing of this strategy, it hits multiple possible take profits, manage your position accordingly.
Risking 1% to make 2%
Use proper risk management
Looks like good trade.
Lets monitor.
Use proper risk management.
Disclaimer: only idea, not advice

next week or two weeks NQ vision as u see in the chart nothing special we need to reach the first high Buyside LQ
then pull back to the last low as second target sellside LQ
note that
any question feel free

Trendline break out NAS100## Entry
- Enter on 4H confirmed trendline breakout
- Look for retest of broken trendline as support
- Ensure price remains above key MAs on 4H
- Verify with increased volume on breakout
## Risk
- Stop below recent swing low/structure
- Risk 1-2% capital
- Size position accordingly
## Targets
1. 20000- 20200 as psychological level
2. 200 MA on daily timeframe
3. 1.5x risk-reward ratio
## Management
- Wait for clean 4H breakout confirmation
- Move stop to breakeven after momentum continues
- Trail stop as price advances toward targets
- Scale out at major resistance levels

US100 H4 | Bearish Fall Based on the H1 chart analysis, we can see that the price has just reacted off our sell entry at 19,514.93, which is ana swing high resistance.
Our take profit will be at 19363.72, a pullback support.
The stop loss will be placed at 19,637.23, above the 127.2% Fibo extension.
High Risk Investment Warning
Trading Forex/CFDs on margin carries a high level of risk and may not be suitable for all investors. Leverage can work against you.
Stratos Markets Limited (tradu.com):
CFDs are complex instruments and come with a high risk of losing money rapidly due to leverage. 63% of retail investor accounts lose money when trading CFDs with this provider. You should consider whether you understand how CFDs work and whether you can afford to take the high risk of losing your money.
Stratos Europe Ltd (tradu.com):
CFDs are complex instruments and come with a high risk of losing money rapidly due to leverage. 63% of retail investor accounts lose money when trading CFDs with this provider. You should consider whether you understand how CFDs work and whether you can afford to take the high risk of losing your money.
Stratos Global LLC (tradu.com):
Losses can exceed deposits.
Please be advised that the information presented on TradingView is provided to Tradu (‘Company’, ‘we’) by a third-party provider (‘TFA Global Pte Ltd’). Please be reminded that you are solely responsible for the trading decisions on your account. There is a very high degree of risk involved in trading. Any information and/or content is intended entirely for research, educational and informational purposes only and does not constitute investment or consultation advice or investment strategy. The information is not tailored to the investment needs of any specific person and therefore does not involve a consideration of any of the investment objectives, financial situation or needs of any viewer that may receive it. Kindly also note that past performance is not a reliable indicator of future results. Actual results may differ materially from those anticipated in forward-looking or past performance statements. We assume no liability as to the accuracy or completeness of any of the information and/or content provided herein and the Company cannot be held responsible for any omission, mistake nor for any loss or damage including without limitation to any loss of profit which may arise from reliance on any information supplied by TFA Global Pte Ltd.
The speaker(s) is neither an employee, agent nor representative of Tradu and is therefore acting independently. The opinions given are their own, constitute general market commentary, and do not constitute the opinion or advice of Tradu or any form of personal or investment advice. Tradu neither endorses nor guarantees offerings of third-party speakers, nor is Tradu responsible for the content, veracity or opinions of third-party speakers, presenters or participants.

Bearish Look for potential Reversal bearish candlestick formation upon the retest of daily supply zone.

NAS100 Breakdown Watch: Bearish Structure Forms Below Key Highs1. Key Levels
Yesterday’s High: 20,037.0
Yesterday’s Low: 19,658.8
Today’s High (so far): 19,912.4
Current Price: 19,844.4
Price is currently trading below today’s high and below yesterday’s high, but still well above yesterday’s low.
2. Structure & Market Flow
The BoS/ChoCh (Break of Structure / Change of Character) indicator marks:
Multiple BoS (green) up to the April 30th peak, showing bullish structure.
A ChoCh (red) occurred just after the top on April 30, followed by more ChoCh signals, indicating potential short-term bearish momentum.
Most recent price action shows consolidation between 19,840–19,912, forming a range after rejecting near today's high.
3. Moving Averages (3EMA)
Blue Line (Short EMA - 20): 19,843.0
Purple Line (Mid EMA - 50): 19,840.3
Price is slightly above both the 20 and 50 EMA, which are now flattening — suggesting neutral momentum with no strong trend currently in place.
4. Market Context / Price Action
The sharp rejection at 20,037 (yesterday's high) indicates supply pressure.
Price wicked above today’s high before dropping below both EMAs.
Price bounced around the 50 EMA and appears to be forming lower highs, showing bearish microstructure.
Current structure looks like a potential distribution pattern.
5. Trade Ideas (Scenarios)
A. Bearish Bias (High Probability if 19,840 breaks cleanly)
Entry: Break and close below 19,840 with volume confirmation.
TP1: 19,700 (just above yesterday’s low)
TP2: 19,658.8 (yesterday’s low)
SL: Above 19,912 (today’s high)
This setup capitalizes on a rejection of key highs, a ChoCh confirmation, and fading bullish momentum.
B. Bullish Scenario (Only if we reclaim today’s high)
Entry: Strong 15-min candle close above 19,912, targeting 20,037 and beyond.
TP1: 20,037 (yesterday’s high)
TP2: 20,100–20,150 (psychological and recent rejection zone)
SL: Below 19,840
This would be a breakout-retest continuation trade, but less favorable given current structure.
6. Bias & Recommendation
Short Bias is currently favored due to:
Repeated ChoCh signals
Price trading below today's high and rejecting yesterday’s high
Weak upside follow-through despite attempts to push higher
Tight consolidation and lower highs forming near resistance

NAS100 | 4H Bullish Breakout from Channel – Eyes on 19,970 ZoneNAS100 4H Chart Analysis
Price broke out of a well-respected descending channel with a strong bullish push. Currently approaching a supply zone around 19,970, where we may see a reaction.
Key Levels:
• Resistance/Supply: 19,970
• Support: 19,450 / 18,823
Technical Notes:
• Breakout confirmation above descending trendline
• Clean retest zone formed at previous structure (around 18,800)
• Watching for either a rejection at supply or continuation into 21,000+
Next Steps:
• Waiting for confirmation: reaction or break of the 19,970 zone
• Will look for 15m–1H entry if we get a pullback to structure

NSDQ100 INTRADAY trend change supported at 18950 Key Support and Resistance Levels
Resistance Level 1: 19590
Resistance Level 2: 20070
Resistance Level 3: 20344
Support Level 1: 18460
Support Level 2: 17820
Support Level 3: 17330
This communication is for informational purposes only and should not be viewed as any form of recommendation as to a particular course of action or as investment advice. It is not intended as an offer or solicitation for the purchase or sale of any financial instrument or as an official confirmation of any transaction. Opinions, estimates and assumptions expressed herein are made as of the date of this communication and are subject to change without notice. This communication has been prepared based upon information, including market prices, data and other information, believed to be reliable; however, Trade Nation does not warrant its completeness or accuracy. All market prices and market data contained in or attached to this communication are indicative and subject to change without notice.
