NAS100... 4h chat pattern Your NAS100 (Nasdaq-100 index) *sell setup* looks like this:
* *Entry (Sell):* 1983
* *1st Target (TP1):* 1845
* *2nd Target (TP2):* 1800
This is a *bearish trade, targeting a roughly **138-point* drop for TP1 and *183-point* drop for TP2.
To evaluate this trade, consider the following:
### 1. *Technical Context*
* Is there a *resistance level* or *reversal pattern* around 1983?
* Are *momentum indicators* like RSI or MACD showing bearish divergence?
* What does the *volume* say — decreasing on up moves, increasing on down moves?
### 2. *Risk Management*
* Where is your *stop loss*? (This is critical to protect against a reversal.)
* What's the *risk-to-reward ratio*? Ideally, aim for 1:2 or better.
* Are you risking a fixed % of your capital (e.g., 1–2%)
NAS100 trade ideas

When the trade gives you much more than you believed was possiblStick to the plan on this one and enjoy! Doubled the move but that should have been expected since we are reaching the outer levels of price expansion.

Nasdaq analysis: 30-APRIL-2025Good morning. Welcome to today's Nasdaq market analysis and educational insights for price action traders.

NASDAQ YEARLY CHART Chart done on 03.05.2025
Nasdaq market conditions are very similar to the 2020 market conditions
as we can see for both years we had a drop in market price for the first few month, then the recovery happened as markets started to stabilize.
this looks to be the same with 2025 as trumps appointment into the white house has caused a similar effect
for the next year nasdaq looks to be bullish so that the US economy can adapt to the new changes.
this is a very basic analysis. if a more in depth analysis is needed. Please feel free to comment

Are You Ready For Nasdaq Next Flight ? 500 Pips Waiting For Us !Here is my opinion on Nasdaq , i think we have a very good closure and we can say we will go up for sometime in the next few days , so i`m waiting the price to go back to my support area ( Lower One ) that already broken , and then we can enter a buy trade and targeting 500 pips . also if the price touch the higher place and give me a good bullish price action , we can enter a buy trade with small lot size and if the price go to the lower one we can add one more contract .

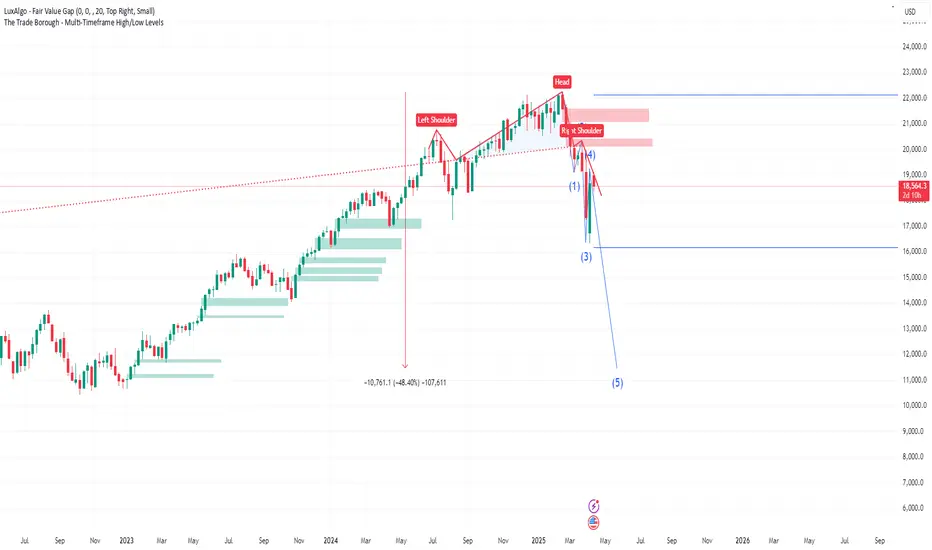
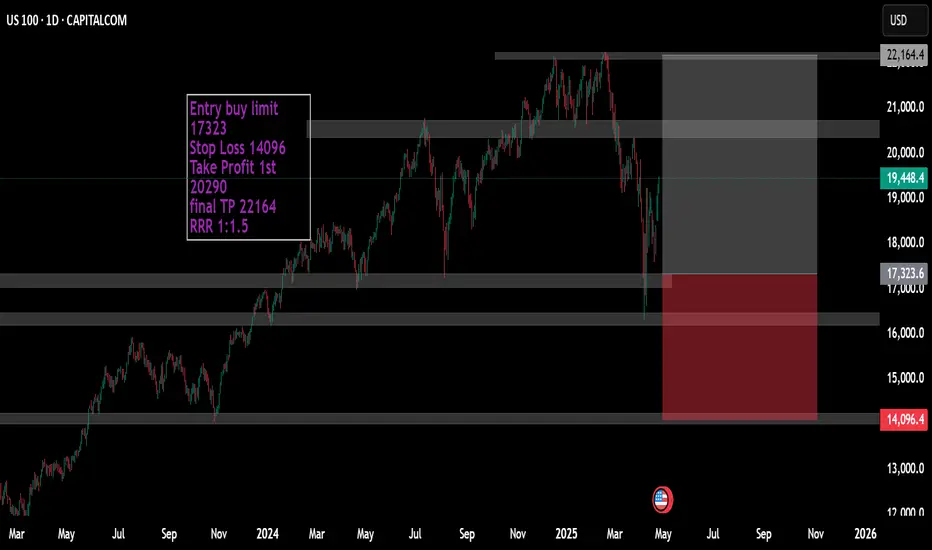
No shampoo in sight.....and an $11k Nasdaq?This posts presents an idea that has no precedence (that I can recall at least), so this is by definition a crazy idea BUT the chart is showing signs of extreme exhaustion and is possibly and quite frankly on the verge of a potentially destructive collapse.
If the recent severe volatility hasn't peaked your attention... this chart should.
It's quite simple...we have a MONSTER Head and Shoulders pattern on the Weekly TF...and we're finishing off the Right Shoulder! From a chart pattern perspective, this is ultra-ultra bearish.
The confluence we have is the Elliot Wave showing the we could be about to enter Wave 5. Elliot Waves are of course subjective BUT in this case its syncs with the Head and Shoulders.
If this was a 15min chart, most would probably agree hands down, but this is a Weekly Chart and represents Trillions on Trillions so its hard to believe that this could even be a possibility.....but I believe it could happen!
The horizontal blue lines provide 2024's High and Low Price. For this disaster scenario to be avoided, the Bulls and anyone who cares must defend 2024's low around 16100. This must not be breached, to keep the 12M bullish structure in place.
The green shaded areas highlight all of the Buy Side fair value gaps on the WEEKLY TF going back to early January 2023!
Could the market dive for these in devastating fashion? Only time will tell.
In the interim, we should trade safe and manage risk as best as we can.
Is a reversal about to happen?Hello, traders
Orange circles highlight repeated price rejection and the formed doji that suggests a slowdown in a bullish wave and potential reversal. The confluence of the descending trendline and horizontal supply/resistance zone creates a high-probability reversal or breakout from this triangle.
If the price rejects again from the current supply zone and triangle, short setup toward the Fibonacci retracements or demand zones (18300 and below).
If the price breaks above the descending trendline, bullish continuation will likely target 20,000+ (Swing H).
Trend remains down.
Entry 19300
TP 18300 below
Target 14k.

Nasdaq market analysis: 28-APRIL-2025Good morning. Welcome to today's Nasdaq market analysis and educational insights for price action traders.

Demand Zone US100 (Potential Long Play) Next week there is a nice opportunity on an identified demand zone on the US100. Due to bullish market Structure, We aim for long positions on demand zones as these are higher probabilities plays than shorts. The demand zone area is the last bearish candle (without upper wick), marked on the 1HR time frame and will be the key area of interest.

NAS100 Bulls Rally – Eyes on 19,860 Resistance Zone!"The NAS100 is sustaining a strong bullish rally after reclaiming the 19,150 🔽 support zone. Price is trading firmly within a bullish structure, but still has some distance to reach the next key resistance at 19,860 🔼.
Currently trading at 19,446, with
Support at: 19,150 🔽, 18,500 🔽, 17,600 🔽
Resistance at: 19,860 🔼, 20,347 🔼
Bias:
🔼 Bullish: As long as price holds above 19,150, bulls remain in control. A breakout and retest above 19,860 could fuel a further move toward 20,347.
🔽 Bearish: A rejection from 19,860 or a break below 19,150 could trigger a decline toward 18,500.
No breakout, no trade.
📛 Disclaimer: This is not financial advice. Trade at your own risk.

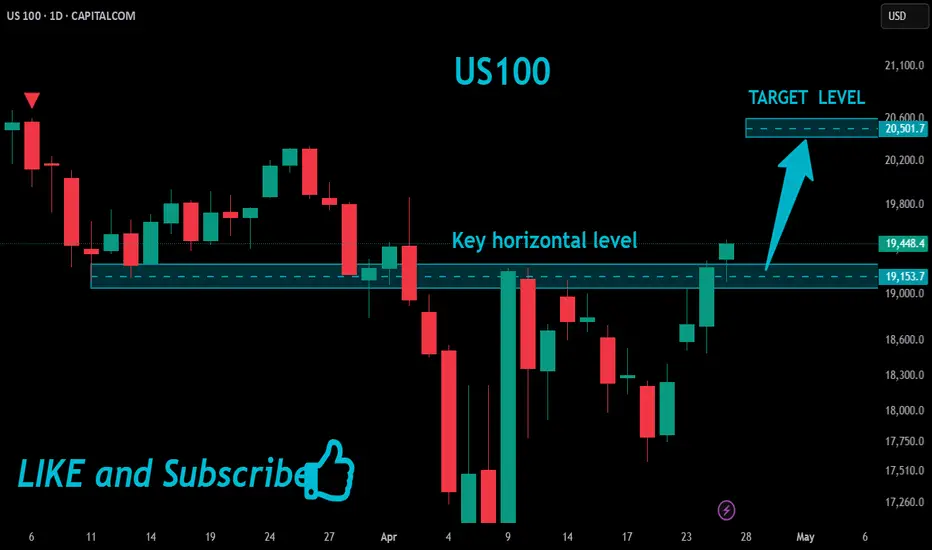
US100 Bullish Breakout!
HI,Traders !
US100 is trading in an
Uptrend and the pair made
A bullish breakout of the
Key horizontal level of 19153.7
And the breakout is confirmed
So we will be expecting a
Further bullish move up !
Comment and subscribe to help us grow !
Nasdaq has broken trendine with signs of reversal.Nasdaq has broken trendine with early signs of reversal.

Nasdaq - Printing The Obvious Bottom!Nasdaq ( TVC:NDQ ) already finished the correction:
Click chart above to see the detailed analysis👆🏻
After we witnessed a minor "crash" of about -25% over the past couple of weeks, the bottom might be in on the Nasdaq. We simply saw another very bullish all time high break and retest and depite the possibility of a second retest, I am (still) extremely bullish at these levels.
Levels to watch: $17.000
Keep your long term vision,
Philip (BasicTrading)

Fear @ Greed Index In Nasdaq.The potential future decline of the Nasdaq index is attributed to concerns surrounding the Fibonacci level of 1.138, as indicated by the harmonic shark pattern .
At the 0.88 level, the fear index has surpassed the greed index, and it currently stands at 1.138. This apprehension is also affecting those who are typically driven by greed.

Nasdaq Top?From a topping structure point of view...
My guess is we are somewhere here today.
Will we get a C rally/bull trap?
Or maybe we fast forward to D?

NAS100USD: Bullish Scalping Opportunity Within Fair Value GapGreetings Traders,
On NAS100USD, the current market structure is clearly bullish. To capitalize on this momentum, we aim to align our intraday opportunities with the prevailing trend.
At present, price has retraced into a fair value gap (FVG), presenting a potential high-probability zone for a bullish reaction. Upon receiving confirmation, this setup offers a favorable opportunity to enter long positions, with the objective of targeting the liquidity pool situated above.
Key Focus:
Structure: Bullish
Entry Zone: Fair Value Gap (retracement)
Target: Overhead liquidity pool
As always, ensure confirmation before executing any trades, and remain disciplined in managing your risk.
Kind Regards,
The Architect

NAS100USD: Bearish Continuation Likely After Liquidity GrabGreetings Traders!
As we transition into the New York session, increased market volatility is expected. Currently, NAS100USD is showing signs of potential further bearish continuation. This outlook is supported by a draw on liquidity toward downside liquidity pools and a notable inefficiency—an unfilled gap left earlier in the week.
Key Observations:
1. Unfilled Gap – A Draw on Liquidity:
The market has left behind an inefficiency in the form of a price gap, which typically acts as a magnet for price. Although such inefficiencies are not always filled immediately, they often become targets for future price movement as the market seeks balance.
2. Reclaimed Order Block Breach – Engineered Liquidity:
Price has recently broken below a reclaimed order block that was serving as a temporary resistance zone. This indicates that the market was hunting for liquidity at a relatively premium price—above a key resistance level. The presence of relatively equal highs in this area further supports the notion that this was an engineered liquidity zone.
Engineered liquidity refers to zones designed by smart money to entice retail participation. Once sufficient liquidity is gathered, institutions then drive price through these zones to execute large sell orders at a premium.
3. Downside Targets – Liquidity Pools and Gaps:
With resistance now confirmed as engineered liquidity, smart money is likely to shift focus to the downside. Key targets include liquidity pools at lower price levels and the aforementioned inefficiency, which represents an area of fair value—ideal for profit-taking and potential continuation of institutional selling.
Trading Strategy:
Monitor price for confirmation within any short-term retracements. Selling opportunities aligned with institutional intent may present themselves as price gravitates toward the inefficiency and deeper liquidity zones.
Stay focused, remain patient, and ensure all trades align with your trading plan.
Kind Regards,
The Architect

NAS100USD: Reclaimed Order Block Signals Further DownsideGreetings Traders!
In today’s analysis of NAS100USD, we observe a momentary shift into bearish institutional order flow, confirmed by the formation of successive lower lows. This structural development signals the potential for continued downside movement.
Key Observations:
Bearish Institutional Order Flow:
The consistent break of lows supports a bearish bias, providing a framework for seeking short opportunities in alignment with institutional intent.
Confluent Bearish Arrays:
Key bearish arrays—including the mitigation block and a reclaimed order block—are currently aligned. These zones, if respected, could serve as strong resistance and provide high-probability entry areas for short positions.
Trading Strategy:
Should price retrace into these arrays and provide confirmation, we can look to enter sell positions with the expectation of further downside aligned with the prevailing order flow.
Stay disciplined, remain patient, and trade only with confirmation.
Kind Regards,
The Architect

Quick technical piece on Nasdaq100From the technical side, we are near the short-term downside resistance line, which if broken, may open the door towards higher areas. But will it be enough?
Let's take a look.
MARKETSCOM:US100
Let us know what you think in the comments below.
Thank you.
77.3% of retail investor accounts lose money when trading CFDs with this provider. You should consider whether you understand how CFDs work and whether you can afford to take the high risk of losing your money. Past performance is not necessarily indicative of future results. The value of investments may fall as well as rise and the investor may not get back the amount initially invested. This content is not intended for nor applicable to residents of the UK. Cryptocurrency CFDs and spread bets are restricted in the UK for all retail clients.

NAS100 | 1H | BUY ZONEHey There;
SIGNAL ALERT
BUY NAS100 / 17,682,18
🟢TP1: 18,000,00
🟢TP2: 18,500,00
🟢TP3: 19,726,64
🔴SL: 16,782,61
RR / 2,2
Please don't forget to like 🙏🏻
Thanks to everyone who supports my analysis with likes. 💙💙💙

NAS100USD: Will Price Fill the Gap?Greetings Traders!
In today’s analysis of NAS100USD, we observe that the market is currently operating within a broader bullish institutional order flow. However, recent price action has left behind an inefficiency—a gap that may serve as a short-term draw on liquidity.
KEY OBSERVATIONS:
1. Gap in Price – Inefficiency Identified:
Price has created an imbalance that is yet to be filled. Typically, such inefficiencies act as magnets for price, drawing it back before resuming its primary trend. In this case, the gap may be partially filled as the market seeks equilibrium.
2. Draw on Liquidity – Last Point of Efficiency:
The last point of efficiency below current price levels may serve as the draw on liquidity. This level could attract price action as institutions look to rebalance orders and facilitate continuation.
3. Active Order Block – Potential Entry Zone:
Price is currently testing a bearish order block. Upon confirmation, this area may offer a short-term selling opportunity with the objective of targeting the liquidity pool and the inefficiency below.
TRADING PLAN:
Entry Consideration:
Look for bearish confirmation within the current order block zone before entering. The goal is to trade the short-term retracement within a bullish environment.
Profit Targets:
Target the liquidity pool and the unfilled gap near the last point of efficiency as short-term objectives.
Remain diligent, patient, and aligned with your trading plan. Always conduct your own analysis to ensure any setup is in harmony with your strategy and risk tolerance.
Kind Regards,
The Architect

Nasdaq market analysis: 23-APRIL-2025Good morning Dear Traders! Join me for Nasdaq market analysis for today. Share your charts, ask questions, and let's discuss trading strategies.
