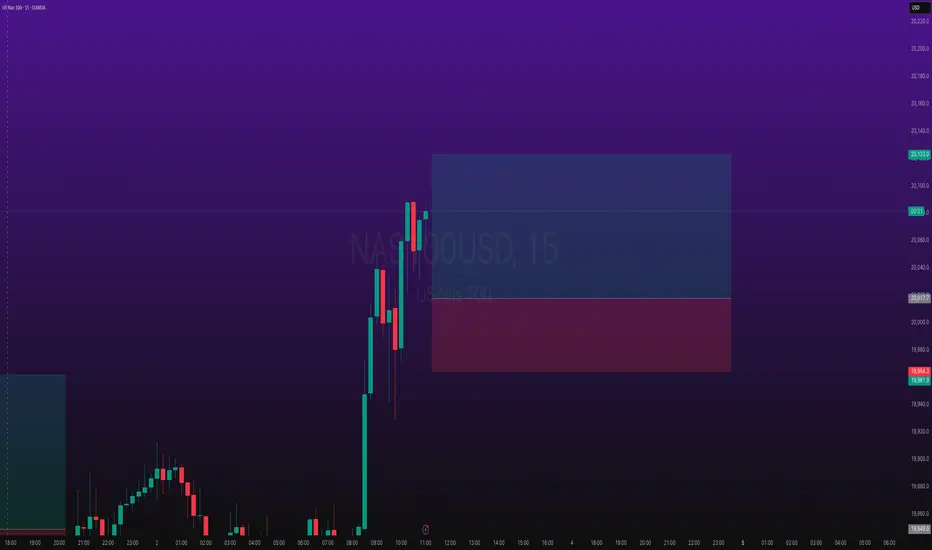
NAS100 1WTake a look at this chart! After a solid uptrend, the price broke an important ascending trendline and corrected down to the 0.5 Fibonacci level — right where a key structural support zone is (that blue area near the bottom).
From there, we’ve seen a strong bounce back upward, and now the price has reached a critical zone:
Previous resistance
The 0.618 to 0.786 Fibonacci retracement area
And most importantly, a retest (pullback) to the broken trendline
There are two possible scenarios ahead:
1. If the price breaks and holds above this resistance zone, we might see the continuation of the bullish move.
2. But if it fails to break through, the market could enter another corrective phase.
Also, keep in mind that we have the interest rate decision this week. With Trump applying repeated pressure, there’s a chance rates might be cut — which could fuel a green, bullish market.
NAS100 trade ideas

X2: NQ/US100/NAS100 Long - Day Trades 1:2X2:
Risking 1% to make 2%
NAS100, US100, NQ, NASDAQ Long for day trade, with my back testing of this strategy, it hits multiple possible take profits, manage your position accordingly.
Risking 1% to make 2%
Use proper risk management
Looks like good trade.
Lets monitor.
Use proper risk management.
Disclaimer: only idea, not advice
Nasdaq LongsShould price retrace to that IFVG level, I will look for a sell side liquidity sweep and go long.

NASDAQ Sell idea🔸 Resistance Strong supply zone around 19,419.5–19,430 (previous high & breakout failure)
🔸 Bearish Structure If price fails to break and hold above 19,430, double top or lower high forms
🔸 Wick Rejection Multiple upper wicks near resistance could signal rejection and exhaustion
🔸 Volume Behavior Potential volume spike without follow-through → trap buyers
🔸 Momentum Divergence If momentum slows on retest of high, weakening bullish pressure


X2: NQ/US100/NAS100 Long - Day Trades 1:2X2:
Risking 1% to make 2%
NAS100, US100, NQ, NASDAQ Long for day trade, with my back testing of this strategy, it hits multiple possible take profits, manage your position accordingly.
Risking 1% to make 2%
Use proper risk management
Looks like good trade.
Lets monitor.
Use proper risk management.
Disclaimer: only idea, not advice

LONG IDEA LASCENDING CHANNEL BREAKOUT NAS100?Looking for a breakout of this upward channel, price above EMA, targeting 27.20 fib level or most recent high before downward trend began.
Opinions?

anyone that is buying is missing outgreat discounts I guess sir Warren Buffet is to buy now? still this good discounts are for everyone to buy.

FOMO hurtsH1 pushed high enough from a FVG
Structure got broke giving another oppertunity to get in
Resting above we got a clear FVG on the Daily tf thats need to be filled
Well lets see What NFP brings to the table
Be safe out there🫡🫡

Is Nasdaq still bullish? Steep correction today as expectedIf you look at my last post, you can see where I explained the expectation.
As range theory would state, the rejection from the bottom of a range creates a target in the high of the range. I have identified the candle top that I believe is the target for this rally.
If the bearish imbalance is stacked with too many orders we will not make it there. We are sitting right around the 50EMA for hourly as well as retesting the break point and bottom of the hourly bearish orderblock as I have marked.
It is in my opinion that the Void will act as a magnetic anomaly and assist in pulling price up as many institutional orders will be in that range, but we'll see 🔑
Share with a friend in need of real guidance 🫡

Finally a correction in indices collective imbalance belowBeen wanting to show you all the mechanics of the correction phase when it happened. A very good formation here, feast your eyes. EASY 🔓


NASDAQ a look ahead...As the NASDAQ and other major U.S. Equity Indexes face the pressure of economic uncertainty, the price action between days show that investors are not quite convinced this bull run has seen its finish line. However, we shouldn't only be looking toward private investor sentiment, but also that of the Federal Reserve's presence in the market and how the bond market reflects the Fed's position moving forward.
As shown here, the all time high for the TVC:NDQ is $22,133.22. Our position is that the NASDAQ must reclaim, retest, and continue beyond the all time high in order for us to continue our confirmation on the bull run. The path described should look as shown below...
In this instance, we can assume the bull run should continue. However, we should also be prepared for an alternate scenario where investors leave risk assets behind to chase non-risk assets (bonds for example). This scenario would look as shown below.
All though these are not the only two possible scenarios, we can most likely expect the future to play out in a similar fashion as the examples.
As for the market metrics to keep an eye on, look to TVC:US10Y for any bond yield manipulation, FRED:RRPONTSYD for market liquidity metrics, and FRED:M1V for M1 money velocity. Furthermore, keep an eye on tariffs for consumer tech ( NASDAQ:AAPL , NASDAQ:NVDA , NYSE:TSM ) and military activity ( NYSE:LMT , NYSE:RTX , NYSE:NOC ). Lastly, keep an eye on the banking and financial sector for more than likely banking deregulations withing the coming years.

nas100nas100 went for 484 pips off the bearish action i took an caught 325 pips after the price action close

NAS100 SELL 1 HOUR TIME FRAMESTRONG SUPPLY ZONE
Fair value gaps to fill
Amazing Range 2:41 Risk Reward, Let's See!

NAS 100 EYESThis is where our eyes currently are, there is a clear gap that the low energy movement is heading toward, challenging a weekly low, with a 4 hour unconfirmed bullish trend. We hope to see more unfold today, Happy Trading. Hit me Up.

Lesson 10: Nas-Daq100 Wick trading analysisAnalyzing Nas 100 trading strategy using wicks as a point of entry.

Technical Breakdown on US100 | 1H TimeframeHere’s the detailed breakdown of the US100 1H Chart based on Volume Profile, Gann analysis, and custom indicators (CVD + ADX):
1. Key Observations (Volume, Gann & CVD + ADX Focused)
a) Volume Profile Insights:
Value Area High (VAH): 19,383
Value Area Low (VAL): 19,220
Point of Control (POC): 19,291.79
High-volume nodes: Clustered around 19,220 to 19,300 (heavy acceptance).
Low-volume gaps: Above 19,400 and below 19,200 — price can accelerate through these zones.
b) Liquidity Zones:
Stop clusters likely at: Above 19,400 (recent swing highs). Below 19,200 (recent breakout area).
Order absorption zones: Around 19,291 (POC) and 19,220 (high bid absorption).
c) Volume-Based Swing Highs/Lows:
Swing High: 19,382 (testing resistance with moderate volume).
Swing Low: 19,220 (breakout launch pad).
d) CVD + ADX Indicator Analysis:
Trend Direction: Uptrend
ADX Strength: ADX > 20 and DI+ > DI-, confirming strong bullish momentum.
CVD Confirmation: Rising CVD + bullish candles = Strong demand and genuine buying pressure.
2. Support & Resistance Levels
a) Volume-Based Levels:
Support: 19,291.79 (POC) 19,220 (VAL & previous demand zone)
Resistance: 19,382-19,400 (current tested highs and potential breakout point)
b) Gann-Based Levels:
Recent Gann Swing High: 19,382
Recent Gann Swing Low: 19,220
Key retracements: 1/2 level: 19,301 1/3 level: 19,274 2/3 level: 19,328
3. Chart Patterns & Market Structure
a) Trend:
Strong Bullish (confirmed by rising ADX and CVD).
b) Notable Patterns:
Ascending Channel: Clear uptrend with higher highs and higher lows inside the purple channel.
Breakout retest: POC retest around 19,291 before moving higher.
No major topping signals yet — still holding structure.
4. Trade Setup & Risk Management
a) Bullish Entry (If CVD + ADX confirm uptrend):
Entry Zone: 19,290–19,310 (near POC support zone)
Targets: T1: 19,400 (swing high breakout) T2: 19,500 (measured move from channel)
Stop-Loss (SL): 19,220 (below VAL and previous swing low)
RR: Minimum 1:2
b) Bearish Entry (If CVD + ADX confirm downtrend):
Entry Zone: 19,380–19,400 (at resistance failure)
Target: T1: 19,290 (POC retest)
Stop-Loss (SL): 19,450 (above resistance breakout trap)
RR: Minimum 1:2
c) Position Sizing:
Risk only 1-2% of trading capital per trade.

Gold Vs. Nasdaq, since 2022Fairly clear here that Gold and Nasdaq correlated in direction until December 2024, at which time the equities market peaked. The two continued to correlate in trend direction until February, where, after several years divergence finally occurred.
Gold continues upward, equities continue lower. This seems to be a clear indication that equities, in this case the Nasdaq, will continue into downward correctional territory while Gold continues into a positive trending direction.

Nas 100 outlookBullish overall for the price to create a new weekly high this week. How the monthly candle will close will dictate terms as to the outlook of the next month's PA

NQ: Upcoming Weekly Analysis!FA Analysis:
1- Earnings season: In my view, it's irrelevant in terms of the data itself! It reflects the pre-tariffs era. Market is always looking forward. However, it gives market the opportunity for a relief, consolidation and rebalancing. So beside the kneejerk reaction, uncertainty is in the driver seat.
2- Trump's policies: The 90-day pause has a big chance to become an Eternity pause. Cracks inside Trump's team about the impacts of these tariffs on their own corporations will make them fleeing Trump's boat. Hence, the rational supporting the Eternity pause. This said, we'll see many tweets highlighting how much Trump is winning to feed his mindset.
3- Key economic data: Economic data will take over the driver seat. Recession and Inflation are the key data for market. Bad data is bad for Equities and vice-versa.
4- FED: Rate cut has increased probability during the next meeting, but for the wrong reasons. Both Trump and market will continue their pressure on the FED. This pressure is translated via Sell-off of stocks and equities.
5- Risk: Beside the uncertainty context, I think agreements between Iran-USA and Ukraine-Russia are underway. This is positive for equities. Gold is your indicator in this front.
TA Analysis:
Weekly TF:
- Not much to update from two weeks ago analysis! Price is in its way to complete Wave 2. Crumbles left.
- Price broke out and closed above the 90-day pause weekly/daily candle. This tells you a continuation up is expected but not too much left in the upper side.
- Economic Data will drive the move. This might last 1-2 weeks.
Daily TF:
- Green daily close with a small size candle.
- A consolidation period is expected to end this Wave 2. So there is no rush to jump in the sell side to catch the top of Wave 3. Here is a good opportunity for swing position that you can build incrementally as the price creates LL from lower TF up to Daily and Weekly TF.
GL!

Price breaking out of a wyckoff balance to go unbalanceMy approach the market was pointing out market had found a balance zone starting on April 9th- today. Today I notice high volume on the bull side towards one of the resistance points which it broke and retraced. One it started to retrace I went to the smaller time frame to look for a sniper entry( 5min bullish and strong delta candle stick rejecting of a low volume node and the session vwap ). The balance zone was $1450 wide so it should go imbalance for the same amount or close. This trade is really a 25rr but im going for 8rr to pass my 2nd phase in my challange. This trade will not hit instill like Wednesday maybe even to the end of next week.

us 100 Buy IDEAUS 100 has entered buy zone
Good idea to buy
Sustained previous support
Making new higher highs
