Pre-market Plan- Consolidating at highs,potential gap fill below(The following is for personal views only and does not constitute investment advice. Please exercise your own judgment before making any decisions.)
Currently on the 4-hour chart, price remains above the 200 SMA. RSI shows slight overbought signals, while the EMA suggests there is still upward momentum. After the Asian session, a short-term downtrend has formed.
Price is currently forming a downward flag, which could lead to further downside movement. After market open, price is likely to first move down to capture liquidity, with primary targets at 19062 and 19038.
If a reversal occurs, there is a high probability for the price to retrace upward to fill the NDOG at 19266. If bulls take control, ideally this should happen before 10:00. Afterward, there is a chance to break through to EHPDA 19505, but considering the overbought market condition and lack of strong catalysts, the probability of a significant move higher today is relatively low. If the price continues to rise, watch levels at 19891 and 20370. Look for reversal opportunities at these key levels.
To the downside, watch PDL 18493, and gaps at 18280 and 18000 as potential targets.
Due to Friday’s influence, the market may range between 19061–19505 today, with a potential move to fill the lower gaps next week. Price action after the open will help further confirm market sentiment.
If Bullish – Price should show a clear rebound after liquidity is taken.
If Bearish – If price breaks 19036 and fails to rebound effectively, expect significant downside.
NAS100 trade ideas

NQ is in its way to complete the Impulsive Swing of Wave 2Today's Plan:
So far, NQ is behaving as expected besides Trump cornucopia tweets:)
NQ might not complete the Impulsive swing today, but the direction is up.

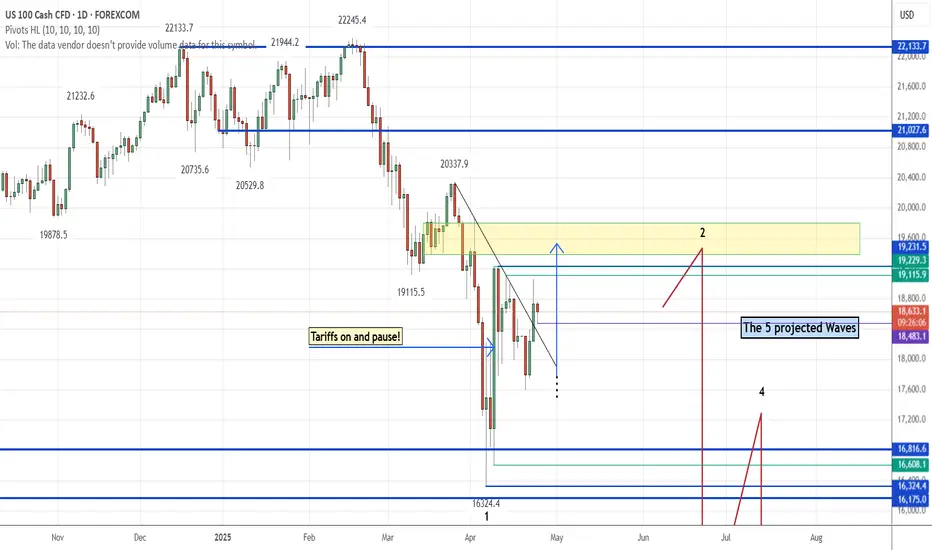
Analysis of Nasdaq 100 (US100) based on Price ActionThis analysis examines the recent price action of the Nasdaq 100 (US100) and identifies potential scenarios based on key technical levels.
Current Situation:
The price has recently moved above a short-term downtrend line, which could indicate a shift in momentum. This development suggests a possibility of upward movement.
Potential Bullish Scenario:
A decisive break and sustained close above the recent resistance level of 19,224 may open the door for further gains. In such a scenario, the index might target the 20,329 level. A successful move beyond that could potentially lead to a test of the historical peak at 22,245.
Potential Bearish Scenario:
Conversely, if the index fails to overcome the 19,224 resistance, there is a chance it could retest previous support levels. These levels are identified at 17,592 and, subsequently, at 16,322.
Conclusion:
The US100 is currently at a critical juncture. The ability of the price to sustain a move above 19,224 may determine its short-to-medium-term trajectory. Both bullish and bearish scenarios remain possible, and traders should monitor price action closely around these key levels.

X2: NQ/US100/NAS100 Short - Day Trades 1:2 RRX2:
Risking 1% to make 2%
NAS100, US100, NQ, NASDAQ short for day trade, with my back testing of this strategy, it hits multiple possible take profits, manage your position accordingly.
Risking 1% to make 2%
Use proper risk management
Looks like good trade.
Lets monitor.
Use proper risk management.
Disclaimer: only idea, not advice

NQ: Same plan-Complete the Impulsive swing within Wave 2Price is in its way to complete the last impulsive swing within Wave 2. There is no urgency to close the gap from the opening week; it will be closed during the move down of wave 3.
Looking to buy from NY opening range.
NASDAQ Breakout Done , 5oo Pips Waiting For Us , Are You Ready ?Here is my opinion on Nasdaq , we have a stop hunt very clear and then we have a very good breakout with amazing bearish candle , so i`m waiting for the price to go up a little to retest the broken support and new Res , and then we can enter with good bearish P.A And Targeting from 300 to 500 pips .

Technical Breakdown on US100 Cash CFD | 1H Timeframe1. Key Observations (Volume, Gann & CVD + ADX Focused)
a) Volume Profile Insights:
Value Area High (VAH): 18,758.52
Value Area Low (VAL): Approx. 18,259.03
Point of Control (POC):
Recent Session POC: 18,758.52
Previous Session POC: 18,259.03
High-volume nodes: Clustered around 18,600–18,750 – area of high interest and possible re-accumulation.
Low-volume gaps: Below 18,300 – could act as fast-move zones on breakdown.
b) Liquidity Zones:
Stop Clusters:
Above 18,800 (recent swing high).
Below 18,250 (previous swing low).
Absorption Zones (Delta Volume Focus):
Strong absorption around 18,580–18,600; price has consolidated here indicating order filling.
c) Volume-Based Swing Highs/Lows:
High-volume swing low: 18,259.03 (POC) – strong buying response seen post drop.
High-volume swing high: 18,758.52 – rejection seen here on low follow-through.
d) CVD + ADX Indicator Analysis:
Trend Direction: Currently Range-bound (CVD not showing clear accumulation/distribution trend).
ADX Strength:
ADX ≈ 18–20: Suggests weakening trend; possible sideways movement.
DI+ ≈ DI-: Confirms indecision.
CVD Confirmation:
CVD flattening at resistance suggests equal pressure from buyers and sellers.
No strong rising or falling trend in CVD; supports ranging bias.
2. Support & Resistance Levels
a) Volume-Based Levels:
Support:
VAL: 18,259.03
Previous swing low/absorption: 18,300
Resistance:
VAH: 18,758.52
Rejection level: 18,800
b) Gann-Based Levels:
Confirmed Gann Lows: 18,259
Key Retracement Levels:
1/3 retrace from recent high: ~18,430
1/2 retrace: ~18,500
2/3 retrace: ~18,580
3. Chart Patterns & Market Structure
a) Trend:
Range-bound (confirmed by ADX near 20 and mixed CVD).
b) Notable Patterns:
Bearish rejection at VAH zone.
Potential descending channel forming from highs.
Fake-out above 18,750 followed by rejection – possible liquidity grab.
4. Trade Setup & Risk Management
a) Bullish Entry (If CVD + ADX confirm uptrend):
Entry Zone: Near 18,300–18,350 (absorption + VAL zone)
Targets:
T1: 18,580
T2: 18,750
Stop-Loss: Below 18,250
RR: Minimum 1:2
b) Bearish Entry (If CVD + ADX confirm downtrend):
Entry Zone: Near 18,750–18,800 (rejection area)
Target:
T1: 18,300
Stop-Loss: Above 18,850
RR: Minimum 1:2
c) Position Sizing:
Risk 1–2% of total capital per trade for optimal drawdown management.

My directional Bias for NASDAQ/USTECH/NAS100/NQAnd stated before in my previous post. This is my idea behind the direction of nasdaq for the next few days. I will be maintaining a bullish bias with an open mind to take advantage of short term sells to fill the inefficiency.

Nasdaq 100 Prepares for Launch — Reclaiming Critical GroundNAS100 8H TECHNICAL ANALYSIS 💻🧠
OVERALL TREND
📈 UPTREND — Structure is shifting bullish. Recent higher lows and strong rebounds from April lows confirm the current upward momentum. This is supported by 12/13 Moving Averages flashing BUY , including critical 50- and 200-period EMAs/SMA clusters. MACD and Momentum indicators also favor continued upside.
🔴 RESISTANCE ZONES
22,248.00 — 🔴 SELL STOPLOSS | Final Pivot High
21,955.77 — 🔴 SELL ORDER 2
21,364.19 — 🔴 SELL ORDER 1
🎯 TARGETS & BUY ORDERS
21,065.42 — 🎯 TP4 | EXIT THE RALLY
19,989.54 — 🎯 TP3 | Momentum confirmation
19,291.55 — 🎯 TP2 | Mid Pivot Zone
18,286.55 — 🎯 TP1 | Initial Profit Target
17,258.99 — ✅ BUY ORDER 1
16,630.74 — ✅ BUY ORDER 2
16,335.10 — ✅ BUY STOPLOSS | Pivot Low
🟢 SUPPORT STRUCTURE
PIVOT LOW @ 18,286 — Support holding for now
PIVOT LOW @ 17,258 — Strong confluence with previous structure
BUY ORDER zones between 16,330 – 17,258 — Demand cluster for reversals
🤓 STRUCTURAL NOTES
MACD shows bullish divergence with a rising histogram and crossover confirmation Momentum (+694) and RSI (66.69) suggest strength, though nearing overbought territory Price has reclaimed 10, 20, 50, 100, and 200 MA levels — rare alignment of major trend confirmation
Only outlier: Hull MA (9) signaling short-term overextension — may suggest brief consolidation before continuation
🌍 GLOBAL TECHNICAL SUMMARY
📊 12 of 13 Major Moving Averages = BUY
📈 MACD & Momentum Oscillators = BUY
🧭 Majority of Oscillators = Neutral — supporting a “calm before breakout” thesis ⚖️ CCI shows slight overbought = caution near resistance zones
📉 No major bearish divergence detected — trend remains intact
TRADE OUTLOOK 🔎
📈 Bullish Bias above 18,286.55 (TP1) targeting 19,291.55 (TP2) and beyond
📉 Bearish rejection likely near 21,065+ if volume fades — monitor RSI/MACD
👀 Watch for volume confirmation as we approach 19,989.55
🧪 STRATEGY RECOMMENDATION
CONSERVATIVE BREAKOUT ENTRY:
— Entry: 18,286.55
— TP Levels: 19,291.55 / 19,989.55 / 21,065.42
— SL: Below 17,258.99
RISK-ON DIP BUY STRATEGY:
— Buy Zone: 16,630 – 17,258
— TP: 18,286.55 / 19,291.55
— SL: Below 16,335.10
“Discipline | Consistency | PAY-tience”

Looks Like a Good Short Term Sell To Me - NDXGood Morning,
We have some double rejection on NDX. Forming a nice consolidation pattern for a break above or below. I am in SQQQ until target zone.
Enjoy!

X2: NQ/US100/NAS100 Short - Day Trades 1:2 RRX2:
Risking 1% to make 2%
NAS100, US100, NQ, NASDAQ short for day trade, with my back testing of this strategy, it hits multiple possible take profits, manage your position accordingly.
Risking 1% to make 2%
Use proper risk management
Looks like good trade.
Lets monitor.
Use proper risk management.
Disclaimer: only idea, not advice

NQ: On its way to complete Wave 2NQ has completed both Initial and retrace swings of wave 2 and now NQ is in its way to complete the Impulsive swing.
We got a breakout and retest of the upper TL and price is moving up.
We have Manufacturing and Services data in a few.
1- Inline data: A shy retrace and continuation up/
2- Undershoot: Price might retest again the upper TL.
3- Overshoot: Direct move up.

CRT CREATEDThis week was a sweep and continue bullish, this was after the market draw on liquidity to send it off upwards. so expectation is the high will be taken out this week or next week if Thursday doesn't fulfil the wish. Monday was the low of the week during New York session causing Tuesday to follow the trend and break Monday's high

Are we out of the woods yet ? From the day chart, it is 50/50 chance as we are in a crucial position.
While we are officially no longer in a bear market, the price action are still weak and has yet to break above the resistance of 19,213 on 9th April which was the day Trump announced a 90 days cooling period.
If the price action over the next week/month continues nicely in the upward channel, then the probability of breaking above 19,213 resistance is more secured.
The challenge remains nobody knows for sure what trump cards does Trump holds and he is well aware his words alone can moves the market. He said he is unhappy with Powell and that causes market jittery, another fall day and the next day, he said he has no intention of firing him.
And we have Bessent saying the de-escalation with China is coming to a close (really?) and that drives the market higher.
I bet it is very tough to be in Trump's team , facing so much pressure and stress and saying things out of proportions on a daily basis. Credibility is definitely at stake, just like a shattered mirror, the cracks will forever be there.
IF you feel extremely uncomfortable and you have positions in the US markets, perhaps trimming some of your holdings might help you to sleep better. Avoid taking on unnecessary risks by betting on short term market moves. The hardest part of trading is psychology and if you got lucky once or twice winning your bets, are you going to stop and not continue ? Or will you bet bigger? 90% of the traders will do the latter thinking they got things under control and that is when the market takes an abrupt turn and kill you without batting an eyelid.
Stay safe, stay wise, always have stop loss if you want to trade, never borrow money no matter how reliable you think your tips/indicators are telling you.

Buy Nasdaq - Candle stick CONFIRMED BUYERS are in control....
- broke through our STRONG RESISTANCE... bearish trend....
Buys Nasdaq.

FOR SCAPLER THATS A SHORT USTECHThemakert is showing a rejection on that trendline so wait in 1 Hour if that candlestic closes a revesal candlestic GO Short to cover The Gap

X2: NQ/US100/NAS100 Short - Day Trades 1:2 RRX2:
Risking 1% to make 2%
NAS100, US100, NQ, NASDAQ short for day trade, with my back testing of this strategy, it hits multiple possible take profits, manage your position accordingly.
Risking 1% to make 2%
Use proper risk management
Looks like good trade.
Lets monitor.
Use proper risk management.
Disclaimer: only idea, not advice

ANALYSE NASDAK US 100now nasdak to way to finish first wave forentre now we need corection nasdak now more 8300 point like and follow our profile for more analyse forex crypto stocks future any help just inbox me our write comment and good luck

Nasdaq 100 (US100) – Bearish Double Top PatternNasdaq 100 shows a clear Double Top pattern, signaling a potential bearish reversal after recent bullish momentum. Price has broken below the neckline, confirming the pattern, and is now heading toward the projected target around 16,500.
Fundamentally, risk sentiment remains shaky amid rising interest rate expectations and mixed earnings reports, adding pressure to tech-heavy indices like US100.
Pattern: Double Top
Bias: Bearish
Target: 16,500
Resistance: 18,000+
Trade Active: Short bias below neckline level
NOTE: This is not financial advice. Trade at your own risk.
Support: Like & follow for more trade ideas!

Eyes on US1001. Took out previous high
2. Change of delivery
3. SELL Limit in place
4. TP @ previous low.
Thoughts?


NQ/US100/NAS100 Short - Day Trades 1:2 RRRisking 1% to make 2%
NAS100, US100, NQ, NASDAQ short for day trade, with my back testing of this strategy, it hits multiple possible take profits, manage your position accordingly.
Risking 1% to make 2%
Use proper risk management
Looks like good trade.
Lets monitor.
Use proper risk management.
Disclaimer: only idea, not advice

NASDAQ-100 (NDX) daily analysis by TradingDONAlright, folks: here’s my take on today’s 15‑minute CAPITALCOM:US100 action—Buckle up.📈
**When the Market Faked Us Out**
I was watching price flirt with a fresh high up around 18,500–18,550, but it couldn’t stick. You know that moment: the rally teases you into thinking bulls have taken over, then promptly rolls over. I marked the false higher‑high with a tiny red “X” on my chart—classic stop‑hunt before the reversal. In plain English: institutions swept buy stops, then handed off into those get‑rich‑quick hopes.
**Key Zones:**
- **Premium (18,800+):** Smart money sells here—price always stalls or dumps.
- **Discount (18,000–18,100):** Institutions buy the dip—bounces here carry weight.
**FVGs & Stop‑Hunt:**
I’ve got Fair Value Gaps around 17,600–17,750 that act like magnets on a pullback. The drop to 17,562.6 was a classic sell‑side stop hunt before the big reversal.
- Distribution hit the Premium zone.
- Accumulation’s brewing in the Discount zone + FVGs.
- That sweep of 17,562.6 was classic smart‑money stop‑hunt + scoop.
- 💡My long at ~17,880 sits at a neat support confluence—so, for now, I’m leaning bullish to the next structural level.
*This is my educational breakdown of ICT concepts—not trading advice. Do your own homework and manage risk.*
