USXUSD D1 FTBOHLC Profile for Monthly Candle
Weekly FVG Delivery Lower
D1 FTB
H4 BOS
HOTW Set
FOMC Delivery towards Previous Monthly Low
Buckle up...
USDX trade ideas

IMP update for all Forex Traders Expect the Dollar Index (DXY) to appreciate in the near future. However, a further decline into the green highlighted region is possible before this upward movement. The green zone represents a potential key reversal area. Monitor the following currency pairs for trading opportunities if the DXY begins to climb:
BUY - USDCAD, USDCHF, USDSGD;
SELL - EURUSD, GBPUSD

29.04.25 Morning ForecastPairs on Watch -
GBPJPY
AUDUSD
EURUSD
A short overview of the instruments I am looking at for today, multi-timeframe analysis down to what I will be looking at for an entry. Enjoy!

DXY... 1H chat patternHere's a breakdown of your DXY trade idea with the proposed parameters:
### 🟩 *Trade Setup:*
* *Instrument*: U.S. Dollar Index (DXY)
* *Position*: Long (Buy)
* *Entry*: 100.00
* *Take Profit (TP)*: 100.80
* *Stop Loss (SL)*: 99.38
### 📊 *Trade Metrics:*
* *Risk (Stop Loss): 100.00 − 99.38 = **0.62*
* *Reward (Take Profit): 100.80 − 100.00 = **0.80*
* *Risk-Reward Ratio (RRR): **0.80 / 0.62 ≈ 1.29*
### ✅ *Pros:*
* Favorable *RRR > 1*, though ideally 2:1 is preferred.
* Buying near the *psychological round number* of 100.00.
* SL is below the identified support at 99.48 and 99.37, offering cushion.
* Target is reasonable and aligns with short-term resistance zones (based on technicals).
### ⚠ *Risks / Considerations:*
* DXY is currently range-bound and sensitive to macroeconomic events (e.g., NFP, Fed speakers).
* SL at 99.38 is slightly wide (\~62 pips), make sure your position size reflects this to manage risk.
* Watch for fakeouts around 100.00 as it’s a key level traders target for stop hunts.
### 🧠 *Final Take:*
Your setup is technically valid and reasonably structured. Just ensure you're accounting for volatility—especially if this trade is held over high-impact news events.
eurusd to 1.1265, dxy confluence eurusd mirrors the dollar and from my analysis i anticipate the dxy to gravitate towards the daily volume imbalance 100.80 zone this will cause the euro to plummet to lower prices so i spotted smooth lows of 1.1265 for first target and daily bullish fvg high for final target at 1.12 zone

DOLLAR DOLLAR ,the double bottom reversal of gold is showing demand to reclaim the 100 mark,if it stays above this zone we could see a strong bullish kick.

DOLLARDXY and Bond Yield Correlation: Key Dynamics in 2025
Core Relationship
The US Dollar Index (DXY) and US 10-Year Treasury yields exhibit a positive correlation, driven by shared sensitivity to Federal Reserve policy, inflation expectations, and global risk sentiment.
Fed Rate Hikes Strengthens USD (DXY ↑) and pushes yields higher
Strong US Growth Bolsters USD and raises yields via inflation risks
Risk-On Sentiment Weakens USD and lowers yields as capital flows to riskier assets
Inflation Fears Raises yields but may not always lift USD if growth concerns dominate
Current Correlation Metrics (2025)
DXY and 10-Year Yield Correlation: Historically positive, with recent coefficients ranging from +0.50 to +0.93 depending on market conditions.
USD/JPY and Yields: Extreme correlation of +0.93 in 2025, reflecting synchronized moves between the dollar and yields.
Key Drivers in 2025
Monetary Policy:
The Fed’s restrictive stance (4.50% rate) supports both USD and yields, but delayed cuts and tariff-induced inflation risks create volatility.
ECB and BoJ dovishness amplifies USD strength, reinforcing the correlation.
Economic Data:
Robust US GDP growth (0.4% Q1 2025) and sticky inflation (2.1% in Germany) keep yields elevated, supporting DXY.
Weakness in global markets (e.g., China, EU) drives safe-haven flows into USD and Treasuries, complicating the correlation.
Fiscal and Geopolitical Risks:
US fiscal deficit concerns and trade tensions (e.g., U.S.-China tariffs) threaten to decouple DXY from yields. For example, rising yields due to debt supply fears may coincide with USD weakness if investors flee US assets.
Bond market turbulence (10-Year yields at 4.47% in April 2025) highlights sensitivity to foreign demand and leverage unwinds.
Exceptions and Divergences
Risk-Off Scenarios: In crises, investors may buy both Treasuries (lowering yields) and USD, creating a temporary negative correlation.
De-Dollarization Fears: Structural shifts, such as reduced foreign appetite for US debt, could weaken the link between DXY and yields despite high rates.
2025 Outlook
Yield Range: Expected to stabilize between 4%–5%, supporting a firm USD if Fed policy remains hawkish.
DXY Trajectory: Faces headwinds from fiscal risks and tariffs but could rebound if global growth slows and US data stays resilient.
Summary Table
Correlation Positive (DXY ↑ as yields ↑), but context-dependent
Fed Policy Primary driver; higher rates lift both DXY and yields
Inflation Supports yields, but may weaken USD if growth falters
Global Risk Risk-off flows can strengthen USD while lowering yields
2025 Risks Fiscal deficits, tariffs, and de-dollarization may disrupt correlation
In conclusion, while DXY and bond yields generally move in tandem, 2025’s unique mix of monetary policy, fiscal strains, and geopolitical shifts introduces volatility. Traders should monitor Fed rhetoric, inflation data, and global risk appetite for directional cues.

De-Dollarization Debunked: Why BRICS Can’t Dethrone the USD!The Dollar’s Throne—Shaky or Rock-Solid?
Picture this: a gang of economic rebels—Brazil, Russia, India, China, South Africa, and their new BRICS+ pals—plotting to topple King Dollar from its global throne. The headlines scream “De-Dollarization!” as if the U.S. dollar is about to be dethroned by a shiny new BRICS currency, backed by gold, blockchain, or sheer ambition. Sounds like a blockbuster, right? Except, here’s the twist: the dollar’s throne isn’t just solid—it’s practically welded to the global economy. So, why does the BRICS crew think they can pull off this heist? And why are they doomed to trip over their own ambitions? Buckle up for a 5,000-word joyride through the wild world of global finance, where the dollar reigns supreme, BRICS dreams big, and the numbers tell a story funnier than a sitcom.
Act 1: The Dollar’s Superpower—Why It’s Still King
Let’s start with a jaw-dropping stat: the U.S. dollar accounts for 88% of international transactions through the SWIFT system and 59% of global central bank reserves as of 2024. That’s not just dominance; it’s the financial equivalent of the dollar flexing its biceps while other currencies watch from the sidelines. The euro? A distant second at 20% of reserves. China’s yuan? A measly 2.3%. The dollar’s grip is so tight, it’s practically giving the global economy a bear hug.
Why does the dollar rule? It’s not just because Uncle Sam prints greenbacks like they’re going out of style (though the U.S. debt is a whopping $34 trillion in 2025). The dollar’s superpower lies in trust, liquidity, and infrastructure. The U.S. has deep, liquid financial markets, a stable (ish) legal system, and no capital controls—things no BRICS nation can match. Want to trade oil? Dollars. Settle a cross-border deal? Dollars. Hide your cash from your dictator boss? You guessed it—dollars. The greenback is the world’s financial comfort food, and everyone’s got a craving.
But here’s where it gets juicy: BRICS thinks they can crash this party. At the 2024 Kazan Summit, Russia’s Vladimir Putin called the dollar a “weapon,” while China’s Xi Jinping pushed for a BRICS “Unit” currency. Sounds spicy, but let’s unpack why this plan is less Ocean’s Eleven and more Three Stooges.
Act 2: BRICS’ Big Dream—And Bigger Problems
The BRICS Fantasy: A Currency to Rule Them All
BRICS (Brazil, Russia, India, China, South Africa, plus newbies like Iran, Saudi Arabia, and the UAE) wants to ditch the dollar for a new currency or a basket of their own—maybe even a gold-backed “Unit.” The pitch? Reduce reliance on the dollar, dodge U.S. sanctions, and flex their collective muscle (they represent 28% of global GDP and 44% of crude oil production). In 2023, one-fifth of oil trades sidestepped the dollar, a shift driven by Russia and China settling in rubles and yuan. That’s a bold move, right?
Except, here’s the punchline: creating a BRICS currency is like herding cats while riding a unicycle and juggling flaming torches. Let’s break down why their dream is a logistical nightmare.
Problem #1: No Trust, No Party
BRICS nations don’t exactly exchange friendship bracelets. India and China? They’ve got border disputes so tense, their soldiers once threw rocks at each other. Russia and China might cozy up to dodge sanctions, but Brazil and India aren’t thrilled about Beijing calling the shots. A common currency needs trust—think the eurozone, where Germany and France (mostly) play nice. BRICS? It’s more like a reality show where everyone’s secretly voting each other off the island.
X posts sum it up: “BRICS replacing the dollar? Mutual distrust and weak legal systems will kill any shared currency initiative.” Without trust, no one’s pooling their reserves or agreeing on who controls the money printer.
Problem #2: The Yuan’s Not Ready for Prime Time
China’s yuan is the closest BRICS has to a dollar rival, but it’s got stage fright. Only 7% of foreign exchange trading involves the yuan, and China’s capital controls keep it on a tight leash. Want to invest your yuan globally? Good luck—Beijing’s not keen on letting cash flow freely. Morgan Stanley’s strategists put it bluntly: “China would need to relax control of its currency and open the capital account. That’s not happening soon.”
Plus, China’s economy isn’t exactly inspiring confidence. Consumer demand is sagging, and the property crisis is dragging on like a bad soap opera. The yuan’s share in global payments via SWIFT is up to 6.4% in 2024, but that’s still pocket change compared to the dollar’s dominance.
Problem #3: Oil’s Not Enough
BRICS+ produces 44% of global crude oil, so why not price it in their currencies? Saudi Arabia’s riyal is pegged to the dollar, and even their flirtation with yuan-based oil deals hasn’t gone far. Why? Oil is only 15% of global trade, and the dollar’s used for everything else—tech, cars, coffee, you name it. Even if BRICS prices oil in rubles or rupees, the rest of the world’s still paying for iPhones in dollars.
And here’s a kicker: at the 2024 BRICS Summit, Russia advised attendees to bring dollars and euros because local banks preferred them over rubles. Talk about an own goal
Act 3: The Dollar’s Kryptonite—Does It Exist?
Let’s play devil’s advocate. Could BRICS pull off a miracle? They’ve got some tricks up their sleeves: blockchain-based payment systems like BRICS Bridge, gold-backed reserves (BRICS+ holds 42% of global FX reserves), and a push for local currency trade. Russia and China already settle 95% of their trade in rubles and yuan. That’s not nothing.
But here’s the reality check: these moves are like bringing a water gun to a tank fight. The dollar’s dominance isn’t just about transactions; it’s about network effects. The greenback’s infrastructure—SWIFT, Wall Street, Treasury bonds—is a fortress. BRICS’ alternative, like the mBridge CBDC platform, is promising but embryonic. It connects China, Hong Kong, Thailand, the UAE, and Saudi Arabia, but it’s nowhere near replacing SWIFT’s global reach.
And gold? BRICS loves it—gold’s 10% of their reserves, half the global average—but it’s not a currency. You can’t pay for Netflix with gold bars, and central banks aren’t keen on lugging bullion around. The Atlantic Council’s 2024 “Dollar Dominance Monitor” says it best: “The dollar’s role as the primary global reserve currency is secure in the near and medium term.”
Act 4: Trump’s Tariffs and the De-Dollarization Drama
Enter Donald Trump, stage right, with a megaphone and a tariff hammer. In 2025, he’s threatening 100% tariffs on BRICS nations if they push de-dollarization. “Any BRICS state that mentions the destruction of the dollar will lose access to America’s markets,” he thundered. Sounds like a plan to keep the dollar king, right?
Wrong. Here’s the irony: Trump’s aggressive tactics might accelerate de-dollarization. Sanctions and tariffs make BRICS nations double down on alternatives. China’s been diversifying reserves and pushing yuan trade for years, partly because of U.S. pressure. As one analyst put it, “Trump’s threats are a rallying cry for BRICS to act.”
But don’t hold your breath. Tariffs hurt BRICS economies (China’s exports to the U.S. are 15% of its total), but they don’t solve BRICS’ internal chaos. India’s External Affairs Minister S. Jaishankar said it plainly: “India has never been for de-dollarization.” Brazil’s also lukewarm, fearing a China-dominated BRICS. Without unity, their currency dreams are just hot air.
Act 5: The Numbers Don’t Lie—Dollar’s Here to Stay
Let’s crunch some numbers to seal the deal:
SWIFT Transactions: Dollar: 88%. Euro: 20%. Yuan: 7%.
Global Reserves: Dollar: 59%. Euro: 20%. Yuan: 2.3%.
Oil Trade: 80% in dollars in 2023, down from 100%.
Global Trade: 50% dollar-denominated.
BRICS GDP: $28.5 trillion (28% of global). U.S.: $25.5 trillion (24%).
The dollar’s share is slipping—reserves dropped from 72% post-WWII to 59%—but it’s still laps ahead. BRICS’ push for local currencies is gaining traction (Russia-China trade is 80% non-dollar), but scaling that globally is a pipe dream. The euro flopped as a dollar rival; the yuan’s too controlled; and a BRICS “Unit”? It’s a concept, not a currency.
Act 6: Thought-Provoking Twist—What If BRICS Succeeds?
Let’s indulge in a wild “what if.” Imagine BRICS pulls it off: a gold-backed Unit currency, blockchain payments, and oil priced in yuan. The dollar crashes, inflation spikes, and Americans pay $10 for a coffee. Scary, right? Former White House economist Joe Sullivan warned BRICS could swing an “economic wrecking ball” at the dollar.
But here’s the catch: a BRICS win hurts BRICS too. Their economies rely on dollar-based trade—China holds $3 trillion in U.S. Treasury bonds. A dollar collapse tanks their assets. Plus, who trusts a BRICS currency when China’s calling the shots? As Ray Dalio noted, de-dollarization is “financial risk management,” not a revolution. BRICS wants options, not chaos.
Act 7: The Funny Finale—BRICS’ Comedy of Errors
Picture BRICS at a poker table, bluffing with a bad hand. Russia’s got rubles nobody wants. China’s yuan is chained to Beijing’s whims. India’s like, “I’m just here for the snacks.” Brazil’s dreaming of free trade, and South Africa’s wondering why they RSVP’d. Meanwhile, the dollar’s dealing cards, smirking, “You sure you wanna bet against me?”
The de-dollarization saga is a comedy of errors—big talk, small results. BRICS’ heart is in it, but their heads are in the clouds. The dollar’s not perfect (hello, $34 trillion debt), but it’s the only game in town. As Morgan Stanley’s James Lord said, “When global markets fall, you want dollars.”
Epilogue: Keep Your Eyes on the Dollar
So, what’s the takeaway? De-dollarization is a catchy buzzword, but BRICS can’t dethrone the dollar anytime soon. The greenback’s too entrenched, BRICS too divided, and the world too hooked on dollar-based trade. Will BRICS chip away at the edges? Sure—expect more yuan trades and blockchain experiments. But a dollar-free world? That’s science fiction, not finance.
For traders, here’s a tip: watch DXY’s inverted head-and-shoulders pattern. A breakout above 100 could signal another dollar rally. For everyone else, laugh at the BRICS hype, stash some dollars under your mattress, and enjoy the show. The dollar’s throne isn’t going anywhere—yet.

USD Is Bullish Short Term. Short The Majors! This is the FOREX outlook for the week of April 28 - May 2nd.
In this video, we will analyze the following FX markets:
USD Index
EUR
GBP
AUD
NZD
CAD, USDCAD
CHF, USDCHF
JPY, USDJPY
The USD Index is heading up towards a bearish FVG. The EURUSD, GBPUSD, and the other Major pairs will be pulled down by this price action .... until the USD hits it's POI. Then things will get interesting!
Take advantage of the USD push higher!
Remember, NFP is Friday! Be careful of wonky price action on Thursday and Friday.
Enjoy!
May profits be upon you.
Leave any questions or comments in the comment section.
I appreciate any feedback from my viewers!
Like and/or subscribe if you want more accurate analysis.
Thank you so much!
Disclaimer:
I do not provide personal investment advice and I am not a qualified licensed investment advisor.
All information found here, including any ideas, opinions, views, predictions, forecasts, commentaries, suggestions, expressed or implied herein, are for informational, entertainment or educational purposes only and should not be construed as personal investment advice. While the information provided is believed to be accurate, it may include errors or inaccuracies.
I will not and cannot be held liable for any actions you take as a result of anything you read here.
Conduct your own due diligence, or consult a licensed financial advisor or broker before making any and all investment decisions. Any investments, trades, speculations, or decisions made on the basis of any information found on this channel, expressed or implied herein, are committed at your own risk, financial or otherwise.

DXY Will Fall! Sell!
Hello,Traders!
DXY keeps strengthening
These last days and the index
Has almost reached a horizontal
Resistance level of 100.500
From where we will be expecting
A local bearish pullback and
A local move down
Sell!
Comment and subscribe to help us grow!
Check out other forecasts below too!
Disclosure: I am part of Trade Nation's Influencer program and receive a monthly fee for using their TradingView charts in my analysis.

DXYU.S Dollar Index
- Completed " 12345 " Impulsive Waves and " AB " Corrective Waves
- Break of Structure
- Change of Characteristics
- Symmetrical Triangle in Short Time Frame
- Order Block

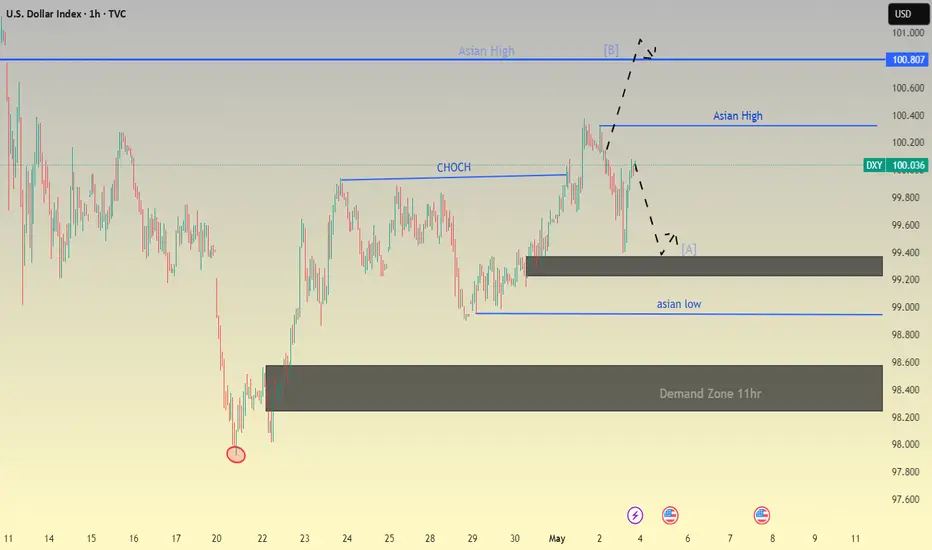
DXY Will Go Up! Buy!
Here is our detailed technical review for DXY.
Time Frame: 5h
Current Trend: Bullish
Sentiment: Oversold (based on 7-period RSI)
Forecast: Bullish
The market is approaching a significant support area 100.036.
The underlined horizontal cluster clearly indicates a highly probable bullish movement with target 100.899 level.
P.S
The term oversold refers to a condition where an asset has traded lower in price and has the potential for a price bounce.
Overbought refers to market scenarios where the instrument is traded considerably higher than its fair value. Overvaluation is caused by market sentiments when there is positive news.
Disclosure: I am part of Trade Nation's Influencer program and receive a monthly fee for using their TradingView charts in my analysis.
Like and subscribe and comment my ideas if you enjoy them!

DXY (US Dollar Index) – Bullish Setup📊 DXY (US Dollar Index) – Bullish Setup from FVG & Trendline Confluence
Price tapped into a well-defined Fair Value Gap (FVG UP) aligning with bullish trendline support. I'm anticipating a small retracement toward the 99.88–99.81 area before continuation upward.
📍 Entry Zone: 99.88 – 99.81 (FVG + Trendline)
🛑 Stop Loss: 99.71
🎯 Target (TP): 100.32
📐 RR: Approx. 1:3
Confluences:
Bullish market structure
FVG filled & respected
Ascending trendline support
Liquidity taken below previous lows
🔔 Watching for bullish reaction after the minor pullback for confirmation.

Bearish for Tuesday??/What are your thoughts ?
I can see those sellsetps getting disrespected going into tomorrow.

US INDEX (DXY) TIME TO BUY !!!HELLO TRADERS
As i can see this chart created a harmonic pattren and it crystal clear showing the levels till it hold above our design Stop Loss Trade War Talks and NFP results with slowing down the inflation shows us that $ will recover from this zone if not break SL make a proper research befor taking any trade we appriciate your cooments and support us Stay Tuned for more updates ...

DXY Bullish Gartley pattern—look for buy opportunities. Demand zone and the market is doing higher high.

USD - Early Stages of a Low?The FOMC rate decision next week will likely have some pull on the matter but for now, the US Dollar is working on its second consecutive green week for the first time since the high in January. Resistance has so far held at last year's swing low of 100.22 but bulls put in some push over the past week and it seems unlikely that the Fed will suddenly go dovish given the overhang of tariff uncertainty.
Notably, the oversold RSI reading on the weekly has started to rectify with the indicator crossing up and over the 30-level. - js

Dollar Index - April ReviewI am looking for a continuation in bullish price action, aiming for low hanging fruits with the first point of interest being 101.917

DXY Technical Analysis – Bearish BiasDXY Technical Analysis – Bearish Bias
Market Structure: The price attempted a recovery but failed to break above a strong supply/resistance zone around 99.30–99.40.
Price Action: A rounded bottom (U-shape) move formed, but instead of continuation, the price rejected the resistance and started to fall.

DXY Printing a Bullish Triangle??The DXY on the 1 Hr Chart is forming a potential continuation pattern, the Bullish Triangle!
Currently Price is testing the 99.6 - 99.8 Resistance Area and battling with the 200 EMA and 34 EMA Band. The reaction to this conjunction could be pivotal in who overcomes: Buyers or Sellers.
Now during the formation of the potential pattern, Price on the RSI has stayed relatively Above the 50 mark being Bullish Territory suggesting Buyers could win the Bull-Bear battle.
Until Price breaks either the Resistance Area or the Rising Support, we will not have a definitive direction in which USD will strengthen or weaken.
*Wait For The Break*
-If Price breaks the Resistance Area, USD will strength possibly heading to the 100.8 - 101 Area
-If Price breaks the Rising Support, USD will weaken possibly heading to the 98.5 - 98.3 Area
Fundamentally, it is said China and USA are possibly getting closer to potentially ending the Reciprocal Tariff War going on with both sides willing to negotiate.
With the USA being the #1 Consumer of Goods globally, other economies can not afford us to not buy their things so I continue to see the Tariff War more as a Strong-Arm for the USA to be able to negotiate better terms!
USD News:
JOLTS - Tuesday, Apr. 29th
GDP - Wednesday, Apr. 30th
Unemployment Claims / ISM Manu. PMI - Thursday, May 1st
Non-Farm Employment Change / Avg Hourly Earnings / Unemployment Rate - Friday, May 2nd
For all things Currency,
Keep it Current,
With Novi_Fibonacci

Bearish Crab Pattern Will Start from 100.7The dollar index has retreated from 100.7, a movement potentially correlated with a bearish crab pattern observed in market analysis.
Further observation is warranted to confirm the validity and predictive power of this pattern in forecasting future dollar index fluctuations.

Analysis of the DXY's Trend and Operational SuggestionsDuring today's US market trading session, from a technical analysis perspective, on the daily chart level, the stochastic indicator forms a death cross and diverges downward, which is undoubtedly a strong bearish signal. In terms of the K-line pattern, the current price continues to be under pressure from above, and the overall trend is weak. At the 4-hour level, the stochastic indicator also forms a death cross and points downward. The K-line presents a horizontal consolidation pattern in the shape of a straight line. This pattern usually indicates that the price is accumulating downward momentum, so it can be regarded as an important basis for bearish sentiment under pressure. By comprehensively considering the technical indicators of various cycles and the K-line pattern, the current market is clearly under the dominance of bears, and its weak characteristics are fully manifested.
The DXY encounters strong suppression at the mid-axis position of the daily chart, and the suppression effect is significant. Combining the current market environment and technical trends, it is expected that the DXY will continue its downward trend, and its subsequent performance remains pessimistic.
DXY
sell@99.700-99.500
tp:99-98.500
Investment itself is not risky; it is only when investment is out of control that risks occur. When trading, always remember not to act on impulse. I will share trading signals every day. All the signals have been accurate without any mistakes for a whole month. No matter what gains or losses you've had in the past, with my help, you have the hope of achieving a breakthrough in your investment.

Bearish forecast for DXYWith regards my previous forecast, we have a strong reaction from Weekly and daily premium arrays.
On the weekly TF, we have IOFED of the SIBI and BSL above previous 2 weeks' highs was taken.
Tf: time frame
IOFED: Institutional Order Flow Express Entry Drill
SIBI: Sellside Imbalance, Buyside Inefficiency.
BSL: Buy side liquidity
