Market Sell-Off! Tech Giants TSLA & NVDA Crash Overall Market Sentiment: The market exhibited notable declines across major technology stocks and the broader S&P 500 ETF (SPY). High trading volumes accompanied these declines, particularly in NVDA and TSLA, indicating strong selling pressure. Investors should monitor upcoming economic data releases and earnings reports for potential catalysts that could influence market direction.
Please note that market conditions can change rapidly, and it's essential to conduct thorough research or consult a financial advisor before making investment decisions.
SPDR S&P 500 ETF Trust (SPY):
Current Price: $572.71
Change: -$10.41 (-1.78%)
Intraday Range: $570.13 - $580.12
Volume: 80,094,868 shares
Analysis: SPY experienced a notable decline, closing near its intraday low, suggesting increased selling pressure.
Gamma Exposure (GEX) & Options Sentiment
🔹 Call Walls (Resistance):
610: Key gamma resistance—bulls must reclaim this level for a reversal.
615-620: If 610 is breached, expect resistance at these levels.
🔹 Put Walls (Support):
575-570: Strong negative GEX area, meaning liquidity could dry up if breached.
565: Next major downside target if bears take control.
🔹 Options Sentiment:
IVX avg: 30.3 (4.75% increase) – Implied volatility is rising, signaling uncertainty.
Put Open Interest: 101.6% – A heavily bearish sentiment, indicating risk of continued downside.
Thoughts
SPY needs to reclaim 580 to avoid further selling pressure toward 570-565.
If 570 fails, expect an acceleration lower to 565-560.
Put positioning is extreme, so any squeeze could lead to a fast recovery, but the trend remains bearish.
🔹 Best Trading Plan:
Bullish Play: Watch for a reclaim of 580 → target 598-610.
Bearish Play: Watch for rejection at 580 or a break below 570 → target 565-560.
--------------------------------------------------------
Apple Inc. (AAPL):
Current Price: $235.33
Change: -$0.37 (-0.16%)
Intraday Range: $233.35 - $237.85
Volume: 45,170,419 shares
Analysis: AAPL showed minor losses, trading within a tight range, indicating potential consolidation.
Gamma Exposure (GEX) & Options Sentiment
🔹 Call Walls (Resistance):
240: Key resistance—bulls must break above this for further upside.
250: Highest positive NETGEX area—major breakout zone.
🔹 Put Walls (Support):
230: Strong put support—buyers defended this level.
225-220: If 230 breaks, downside acceleration could occur.
🔹 Options Sentiment:
IVX avg: 36.3 (4.21% increase) – Implied volatility is rising, signaling increased uncertainty.
Call Open Interest: Moderate bullish interest above 240.
Thoughts
AAPL must reclaim 240 to regain bullish momentum toward 245-250.
If 230 fails, expect downside toward 225-220.
IVR is high, meaning a big move is coming—watch for a breakout or breakdown.
🔹 Best Trading Plan:
Bullish Play: Watch for a breakout above 240 → target 245-250.
Bearish Play: Watch for rejection at 240 or a break below 230 → target 225-220.
--------------------------------------------------------
Tesla Inc. (TSLA):
Current Price: $263.45
tradingview.com
Change: -$15.66 (-5.61%)
Intraday Range: $260.02 - $277.88
Volume: 98,451,566 shares
Analysis: TSLA faced significant selling pressure, closing near its intraday low, which may indicate bearish sentiment.
Gamma Exposure (GEX) & Options Sentiment
🔹 Call Walls (Resistance):
280: Key resistance—TSLA needs to reclaim this level for upside.
300: Major breakout zone—bulls need significant momentum to reach this level.
🔹 Put Walls (Support):
250: Strong put wall—buyers may step in here, but a break could lead to further selling.
249.89: If this level is lost, TSLA could drop sharply.
🔹 Options Sentiment:
IVX avg: 84.9 (7.5% increase) – Implied volatility is soaring, meaning a major move is coming.
Call Open Interest: Only 17.3%, showing weak bullish positioning.
Thoughts
TSLA needs to reclaim 265 for bulls to take control.
If 250 fails, expect downside toward 245-230.
High IVR (93.2) suggests a massive move is coming—be ready for volatility.
🔹 Best Trading Plan:
Bullish Play: Watch for a breakout above 265 → target 280-300.
Bearish Play: Watch for rejection at 265 or a break below 250 → target 245-230.
--------------------------------------------------------
Alphabet Inc. (GOOGL):
Current Price: $172.35
Change: -$0.65 (-0.38%)
Intraday Range: $170.25 - $174.81
Volume: 28,301,953 shares
Analysis: GOOGL experienced a modest decline, remaining within its recent trading range.
Gamma Exposure (GEX) & Options Sentiment
🔹 Call Walls (Resistance):
175: Key resistance—bulls must break above this to continue the rally.
180: Stronger call resistance, meaning sellers may defend this level.
🔹 Put Walls (Support):
170: Immediate support—holding for now.
165: Major put support—if broken, selling could accelerate.
🔹 Options Sentiment:
IVX avg: 39.5 (2.5% increase) – Implied volatility is slightly rising.
Call Open Interest: 31.12% at 175, showing a possible breakout level.
Thoughts
GOOGL must break 175 for continued upside toward 180.
If 170 fails, expect a move back to 165-160.
With low put pressure and positive GEX, a breakout seems more likely.
🔹 Best Trading Plan:
Bullish Play: Watch for a breakout above 175 → target 177.5-180.
Bearish Play: Watch for rejection at 175 or a break below 170 → target 165-160.
--------------------------------------------------------
NVIDIA Corp. (NVDA):
Current Price: $110.57
Change: -$6.76 (-5.76%)
Intraday Range: $110.23 - $116.44
Volume: 321,181,861 shares
Analysis: NVDA saw a sharp decline with high trading volume, suggesting strong selling interest.
Gamma Exposure (GEX) & Options Sentiment
🔹 Call Walls (Resistance):
122: First key resistance—NVDA needs to reclaim this for bullish momentum.
130: Stronger gamma resistance, meaning sellers may defend this level.
🔹 Put Walls (Support):
110: Highest negative NETGEX—if this level breaks, a big drop is likely.
105: If selling pressure continues, this will be the next support zone.
🔹 Options Sentiment:
IVX avg: 72.7 (4.83% increase) – Rising implied volatility suggests traders expect big moves.
Call Open Interest: Low at 8.9%, indicating weak bullish positioning.
Thoughts
NVDA must hold 110 to avoid further downside to 105-100.
If 115 breaks, expect a move back to 122-126.
High IVR (51.2) means volatility is increasing—be prepared for a breakout.
🔹 Best Trading Plan:
Bullish Play: Watch for a breakout above 115 → target 122-126.
Bearish Play: Watch for rejection at 115 or a break below 110 → target 105-100.
--------------------------------------------------------
Advanced Micro Devices Inc. (AMD):
Current Price: $98.85
Change: -$2.83 (-2.78%)
Intraday Range: $98.28 - $101.07
Volume: 28,984,978 shares
Analysis: AMD declined moderately, closing near its intraday low, indicating potential continued weakness.
Gamma Exposure (GEX) & Options Sentiment
🔹 Call Walls (Resistance):
$102-$104: AMD needs to clear this range for a bullish reversal.
$105: Larger call interest here—strong resistance if the stock rallies.
🔹 Put Walls (Support):
$100: Major decision point—if this breaks, AMD could drop fast.
$95: Strongest put wall—bears will likely push toward this level if weakness continues.
🔹 Options Sentiment:
IVX avg: 55.8 (4.43% increase) – Implied volatility is rising, suggesting traders are expecting bigger moves.
Call Open Interest: Low at 12.7%, meaning bulls are not yet aggressively positioned.
Thoughts
AMD is at a make-or-break level at $100.
If $100 holds, we could see a bounce toward $104-$105.
If $98 breaks, AMD could drop toward $95-$90 quickly.
High IVR (47.6) signals increasing volatility—expect a breakout soon.
🔹 Best Trading Plan:
Bullish Play: Look for a breakout above $102, targeting $104-$105.
Bearish Play: If $100 fails, short below $98, targeting $95-$90.
--------------------------------------------------------
Meta Platforms Inc. (META):
Current Price: $627.93
Change: -$28.60 (-4.36%)
Intraday Range: $624.31 - $652.99
Volume: 13,446,454 shares
Analysis: META experienced a significant drop, closing near its intraday low, which could signal bearish momentum.
Gamma Exposure (GEX) & Options Sentiment
🔹 Call Walls (Resistance):
$660-$700: Heavy resistance—META needs to clear this for a real bounce.
$720: Stronger resistance, unlikely unless a big rally happens.
🔹 Put Walls (Support):
$620: Short-term support—watch for a reaction here.
$600: Critical zone—if broken, META could free-fall.
🔹 Options Sentiment:
IVX avg: 45.3 (5.26% increase) – Implied volatility rising, indicating traders expect bigger moves.
Put Open Interest: High at $600, meaning downside protection is in place.
Thoughts
META is testing key support at $620—a make-or-break zone.
If $620 holds, we could see a bounce toward $660+.
If $620 fails, META could break down toward $600 or lower.
Options data suggests high volatility ahead—be prepared for a sharp move.
🔹 Best Trading Plan:
Bullish Play: Look for a breakout above $655, targeting $660-$700.
Bearish Play: If $620 fails, short below $620, targeting $600-$580.
🚨 Disclaimer: This analysis is for educational purposes only and does not constitute financial advice. Always conduct your own research and trade with proper risk management.
VIX trade ideas

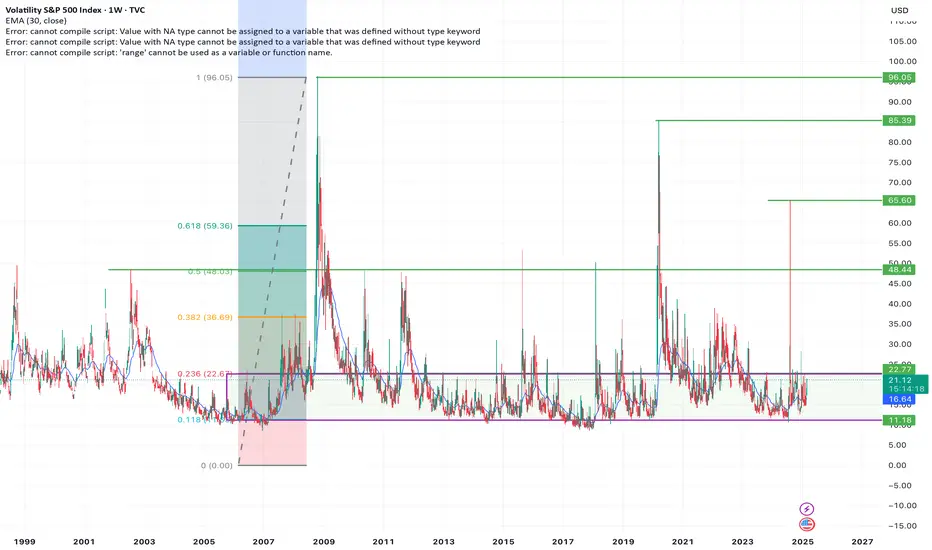
Greatest Volatility of all times is approaching...#vix the volatility index has been accumulating since covid 2020 crash. In higher time frame, TVC:VIX has broken out in 5th August 2024 and it was just a test!.. Then continued consolidation till this time , also doing the retest. at this zone, accumulation of the 2020 covid crash for a new impulsive wave!..
In lower time frame , several days ago VIX broke out the accumulation zone coming from 5th August and this warns you about your greedy positions my friends. We haven' t seen a real great volatility since covid crash and VIX chart is getting alarming. You' ve been warned. Not financial advice.
Temporary INVALIDATION: If VIX dumps below 13 zone , this will be more secure. Below 10 is the main invalidation.

VIX/BTC Relationship up-dateFollowing up on my previous postings on the VIX/BTC relationship and possible conclusions from it on a successful trade, I up-dated my analysis as my personal view on the matter.
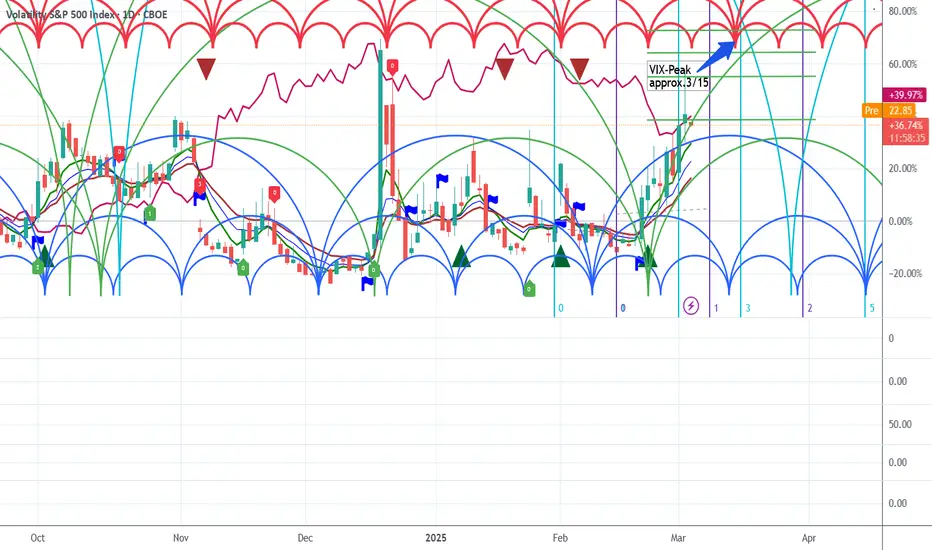
From a cycle analysis perspective, we will get a VIX peak around 3/15 to 3/19, which means we will get a BTC trough as well around that time. The VIX might go into the 30th as we have not yet approached the SPX trough, though we might get a bear flag for a few days before it goes down again, bcs the market is oversold.
Conclusions: watch IBIT, MSTR for a short/interm. term successful trade! Stay save ....
Going lower until the 12thThis channel is not providing individualized trading or investment advice, nor is it a banking service, brokerage service, trading service, investment service or money management service.

VIX/USDT.D - Is crypto the next volatility? I like to follow unusual ratios.
I also regularly follow those that make sense for at least a few years.
VIX/USDT.D is one of them.
What I see when I examine the chart actually makes me think that no matter how positive I try to think, there is a high probability of a southward price movement for crypto assets.
I predict that we will see more volatility in crypto assets than in the classical markets in the coming period and that this will be bearish for crypto assets.
Good luck to everyone.

VIX going higher: Sector Rotation UnderwayTVC:VIX is the tool I use for market timing. It tells us a lot. When it spikes to a Resistance (often 50% of the last major high) that tends to be a market bottom. But when you see what it is doing the last few weeks: Closing sustainably higher each bar... you know the market is pricing in more volatility.
VIX is known as the "fear index" and you can extrapolate that out to see that fear is increasing. The VIX is also the most forward looking indicator I have found for the stock market. All signs point to more broad market downside.
Another thing going on in context is a clear Sector Rotation. I noticed this last week but today's look at the Sector ETFs make it more clear. Not everything is down; AMEX:XLP and AMEX:XLU are up even as AMEX:SPY makes new lows. What this tells me is that investors are fleeing into "quality" stocks with low volatility and that pay dividends.
I'm currently sitting in cash, waiting for opportunities, and hedged some of my long term tax advantage accounts in AMEX:SH

Discipline is the keyThis channel is not providing individualized trading or investment advice, nor is it a banking service, brokerage service, trading service, investment service or money management service.

Vix is predicting a Black Swan EventI believe contrary to common thought; TVC:VIX is chartable with definitive patterns it follows. The pattern in question? Basic double bottom consolidation phases followed by breakouts bull flags retest of the bull flag bottom and follow through from there. We are currently breaking out of 2 double bottom patterns on the chart; one double bottom is the consolidation being used as the stand in for retest of the bull flag bottom with the bull flagpole being the sharp rally back in March 2020. The 2nd double bottom the chart is simultaneously breaking out of is the huge double bottom consolidation with the first bottom being from '91 to '08 while 2nd bottom is from '09 to now. Based on all of the above evidence I believe Vix is predicting a black swan event of biblical proportions for the market

Is a Massive Surge to $100 Coming in March 2025?Understanding the VIX Index: A Comprehensive Analysis for Market Predictions
The VIX index, often referred to as the “fear gauge” of the financial markets, provides crucial insights into market volatility. Since its inception, the VIX has been a valuable tool for investors and analysts seeking to gauge market sentiment and potential turning points.
Historical Overview and Elliott Wave Analysis
Our analysis traces back to the market bottom around November 2017, where the VIX index embarked on an upward trajectory in a three-wave pattern, identified as an ABC structure. The wave B was characterised by a triangle formation, and the concluding wave C terminated around the $85 mark. Following this, the VIX entered a corrective phase, forming a W-X-Y pattern. In this structure, wave W was a zigzag, wave X formed a triangle, and wave Y concluded around the 14.47 level.
Potential Bullish Signal and Market Implications
Looking ahead, we anticipate that a breach of the 22.51 level could trigger a bullish signal for the VIX, potentially driving it towards the $100 target by late March 2025. This projection suggests that the S&P 500 may experience further declines until this timeframe.
Seasonality and Confirmation of Analysis
Supporting our analysis is the seasonal pattern of the VIX, indicating a market bottom around mid-February and a peak in mid to late March. This seasonal behaviour aligns perfectly with our Elliott Wave Theory, Gann analysis, and Fibonacci projections, reinforcing our forecast of a significant market movement.

Keep an eye on VIX above $22.50 We might see a retest of ATH's on VIX if we get a break out of $22.50 and above before April 15, 2025.
Stock market dump. Crypto dump and VIX pump. DXY rally to new ATH's.
Rinse out the norm's not fear when you're aware and ready.
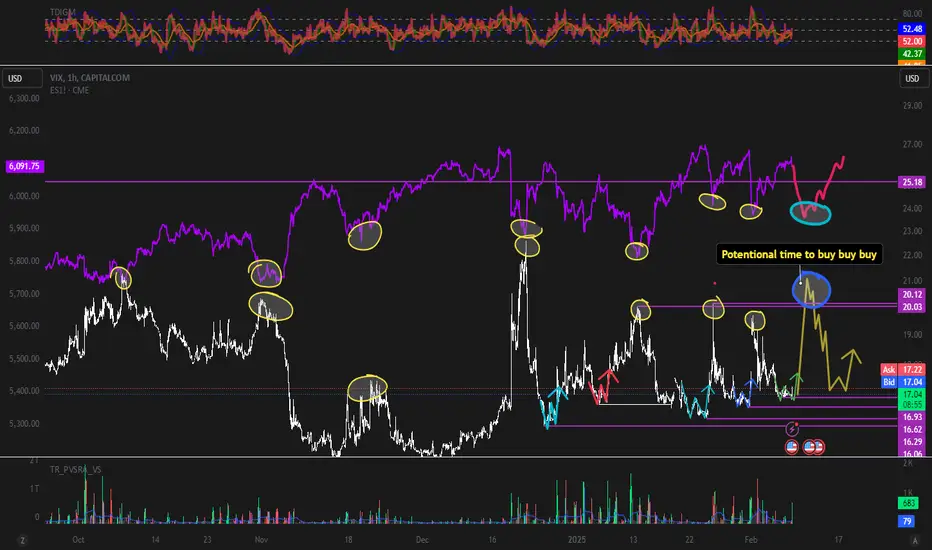
VIX MODEL Gave a BUY SPY today The chart is the 4 hr and daily VIX model I have Buy signal in the SPY as a result of it . BUT SOON we will move from it being a BUY to just a very bearish signal this is coming rather soon . BUT NOT YET , Best of trades WAVETIMER

Market Open: VXX Pops...This morning, the VIX popped to $19.26, not seeing levels like this since the Jan. 27th, 2025 jump to $19.93, where the SPY saw an almost 3% drop, NASDAQ dropped 5%.
We saw concerns of heightened market uncertainty, with investors weighing robust consumer spending against mixed economic signals. There were murmurs that the subdued durable goods orders and emerging signs of slowing GDP growth might signal that the current momentum is hard to sustain. Additionally, dovish cues from the Fed—which hint at a more cautious approach to rate hikes—raised questions about whether these measures could ultimately mask underlying inflationary pressures and economic challenges.
On the corporate front, the market was further rattled by underwhelming earnings reports from several key technology players, a sector that had previously driven much of the market’s optimism. This divergence in performance—where defensive sectors such as consumer staples and financials held their ground while growth stocks stumbled—added to the overall anxiety.
Finally, the backdrop of ongoing geopolitical tensions and sporadic trade disputes continued to contribute to a risk-off sentiment, ensuring that market volatility remains elevated.
Follow us for more Financial & Investment News at @MyMIWallet

Careful guys. Dont let them take your money.Expanding fractal. Watchout guys. can get nasty later this year.

Wait until the 24th This channel is not providing individualized trading or investment advice, nor is it a banking service, brokerage service, trading service, investment service or money management
service.

VIX Shark Is Set to Soar. the VIX Shark is about to go through the roof, like seriously, it's set to soar by about 14.6!
That's some crazy movement right there. I can already picture the market going wild with all that volatility.
It's like the calm before the storm, you know? Better hold on tight and brace ourselves for some serious action.
Who knows what's gonna happen next? It's like a rollercoaster ride, but for your investments. So, if you're in the game, get ready for some adrenaline-pumping moves.
And if you're not, well, maybe now's the time to dip your toes in and see what all the fuss is about . Either way, it's gonna be one heck of a ride!


Prepere yourself for buying opportunities ... So there we are ... CPI little bit higher than exceptating , powel clearly talks about monetary policy and Trump goin wild with tarrifs ... what to except in this macro&political economic driven environment ? I don't think it will grow to extreme values now. Rather, there will be some more carving and from a short-term perspective an opportunity to buy at a good price ... Well, it is very important, at least for me in this environment of a trade war combined with a period when historically the Fed has raised rates and not lowered them as many expect. It is important to take profits and hold losses short and uncompromisingly exit losing positions. The year 2025 will be full of opportunities, which goes hand in hand with pain. What is heaven for one guy is hell for another guy. I am a fan of everyone who tries to make money in this environment and I hope to rob you of your money. Because that is what the market is about. Good luck and enjoy your game

Based on my quantum algorithms VIX will drop to 9.85!!!!Based on my quantum algorithms VIX will drop to about 9.85, lows that have not been broken since 2018!

Trading the VIX - A Balanced Strategy for Smart InvestorsWarning:
This strategy is presented as a trading idea and should not be considered guaranteed trading guidance. Traders are responsible for their own decisions and should carefully evaluate risks before executing any trades.
Given that VIX is generally between 13 and 20, I designed this option strategy.
Combination VIX Vertical Spreads
Strategy Overview:
Days to Expiry (DTE): 37
Option Positions:
Buy VIX 13 Call
Sell VIX 15 Put
Sell VIX 20 Call × 2
Visualized Setup
Strategy Summary:
This strategy results in a combination resembling a modified short straddle centered at VIX 20. However, in structure, it is better understood as a short strangle (neutral) combined with a bull call spread (bullish). The bullish component of the spread suggests that the trader expects the VIX to rise above 13 but remain below 20. The inclusion of a short strangle component helps offset the premium of the debit call spread.
This structured approach allows for a calculated risk-reward balance, aligning with the trader’s outlook on implied volatility while leveraging option spreads to optimize capital efficiency.
Risk and Reward Assessment:
The strategy is heavily weighted towards a long VIX bias, meaning the trader anticipates an increase in VIX, though at a measured pace within a month.
There is a slight increase in risk to the short side of VIX due to the exposure created by the short options.
The expected profit range suggests that VIX volatility will stay within a defined range of 14 to 24. While the trader acknowledges the possibility of VIX exceeding 20, it is not expected to surpass 24.
The probability of profit at expiry is estimated at 65% if entered today. Despite the additional short-side risk, the overall risk remains comparable to a standard short strangle.
Historical VIX data indicates that the index fluctuates between 12 and 40 on a monthly basis, with a 52-week high of 65.7 and a 52-week low of 10.6. This reinforces the strategy’s inherent higher risk to the long VIX side.
Key Considerations for Execution:
Event Risk: Confirm that no major events (e.g., geopolitical instability, Federal Reserve announcements) are expected that could push VIX above 30.
Entry Timing: Optimal entry is when VIX is at a relatively low level, such as observed last Friday (2/7/2025) morning.
Exit Strategy: The position should be closed in approximately two to three weeks or when profit exceeds 100%.
Notes and Alternative Strategy:
One challenge of this strategy is the uncertainty in determining a precise stop-loss strategy. However, given the nature of a strangle, there is no immediate need to exit within the first 20 days, making it a relatively "lazy" management strategy. The trader has ample time to adjust after the initial 20-day period.
Management should be approached by treating the bull call spread and short strangle separately. Given the natural variance of VIX, this approach should not be overly difficult to execute.
A suggested alternative strategy might provide more controlled risk exposure. For example, I would start the trade with a butterfly at 20 if I see the potential rise of VIX. Then, I would reassess it after 30 days (assuming DTE=37; a shorter DTE may also be considered). Alternatively, I could simply wait until expiration day to make a final decision. This strategy has a limited loss while maintaining a similar profit potential.
The suggested strategy manages the cost-efficiency aspect while also limiting potential losses. The decision-making process can then be based on market direction after the expected conditions begin to form.
In comparison to the original strategy in terms of profit and exit timing, the proposed strategy may offer a faster exit, whereas a butterfly setup may require waiting until expiration. However, traders may find early exits possible for condors or strangles.
Here is a visualization of the alternative setup:
Alternative Strategy Visualization
Thank you for reading. Wish you a successful options trading!

Are we in for a surprise on Monday?TVC:VIX
Can Volatility cycles be estimated using the VIX chart? I tend to look for information that shows time based confluence. How do you use the VIX for your trading style? Comment down below!

VOLATILITY is loading...#vix the volatility index is gaining momentum for another strike to markets. Take care on your risky positions and assets like #stocks and #crypto

VIX & SXP There is some W on actual lows in VIX , so if it will play out ...It will be next higher low on VIX. It could lead in to higher high. Time will show how markets react on today employment data .I think it was little bit pro inflation with can lead in to stronger DXY situation ...
VIX LONGTechnicals
1. Gap fill
2. Price reached equilibrium
3. Break of structure to the upside
4. Price to take out trend line liquidity
Fundamental
1. NFP Friday
