PNUT/USDT: FALLING WEDGE BREAKOUT ALERT!!🚀 PNUT Breakout Alert – 100%+ Potential Incoming?! 👀🔥
Hey Traders! If you're all about high-conviction plays and real alpha, smash that 👍 and tap Follow for more setups that actually deliver! 💹💯
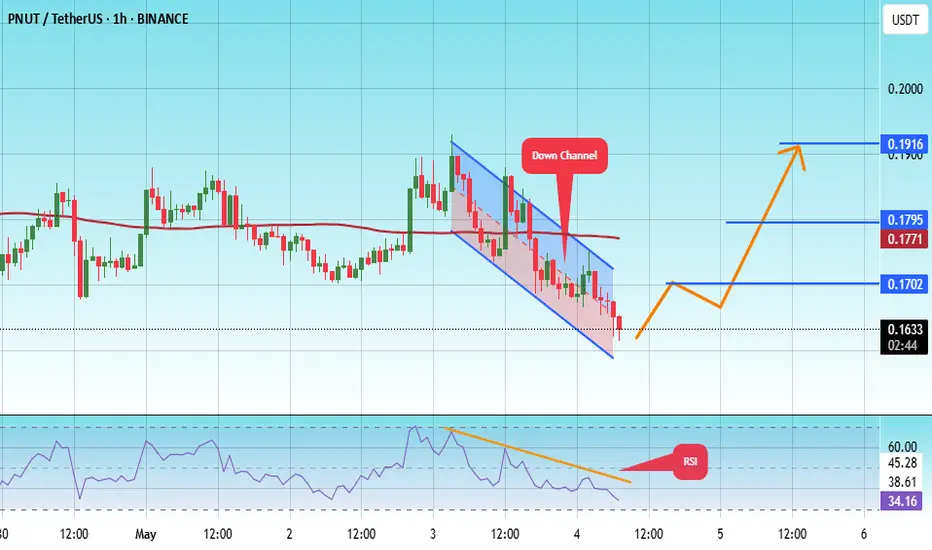
PNUT has officially broken out of a falling wedge structure — a bullish reversal pattern we've been eye

#PNUT/USDT#PNUT
The price is moving within a descending channel on the 1-hour frame, adhering well to it, and is on its way to breaking it strongly upwards and retesting it.
We are seeing a bounce from the lower boundary of the descending channel, which is support at 0.1595.
We have a downtrend on the RSI

Testing Red Resistance – Breakout Potential!🚀 $PNUT Testing Red Resistance – Breakout Potential! 📈
$PNUT is currently testing the red resistance zone. If the price breaks through, the first target could be the green line level! 📊
Let’s catch this breakout together! 💼💸

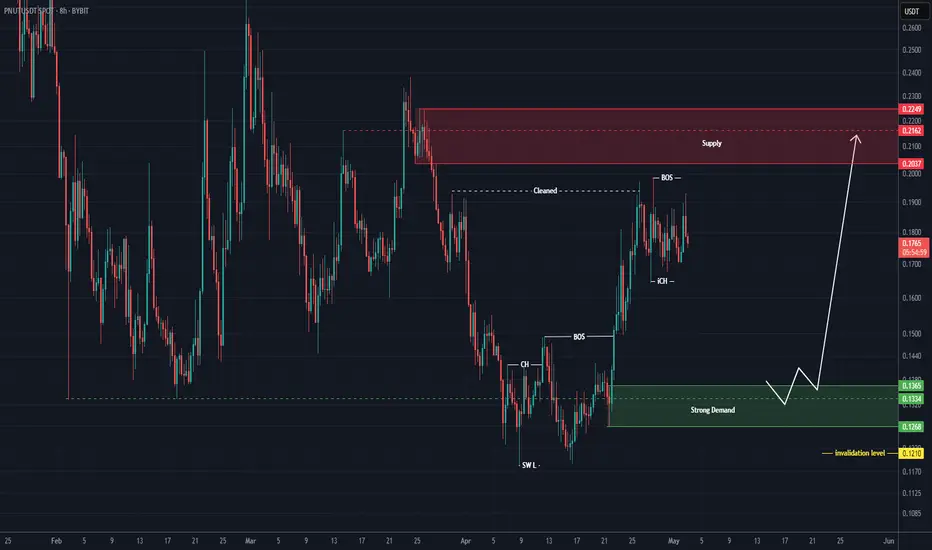
Strong rebuy setup for PNUT (8H)Note: This is not a sell/short setup | it is a buy/long setup.
After clearing resistance order blocks and a strong bullish move, buyers seem to have exhausted their momentum and may need a retracement for price to return to their base.
We are looking for a rebuy within the green zone. The price is
PNUTUSDT Analysis D1PNUTUSDT Building Up For Solid Breakout, Test Descending Trendline & On Verge Of Solid Breakout, usually This Type Consolidation Under Resistance Lead Massive Breakout, Expecting 2x After Breakout.

PNUTUSDT Ready to Rally!PNUTUSDT Technical analysis update
PNUTUSDT is breaking out of a wedge pattern on the daily chart after three months of formation. We also observed a bullish RSI divergence in the daily timeframe, along with a MACD bullish crossover a few days ago. A 50–100% move could be seen in the mid-term.

PNUT Reversal Arc: From Panic Low to 120% Rebound Potentia
The PNUT/TetherUS daily chart from May 10, 2025, presents a compelling case for a powerful recovery rally, despite today's sharp correction (-12.87% on 364.19M volume). While current price action appears bearish at first glance, the broader technical structure reveals an exceptional buying opportun

PNUTUSDT 1D AnalysisPNUT ~ 1D Analysis
#PNUT Buy gradually from here with a short -term target of at least 10%+ from here.

PNUT / USDT – Daily AnalysisBullish divergence spotted!
Price is printing lower lows, but RSI is making higher lows — a classic bullish divergence pattern. This signals potential trend exhaustion on the downside.
#PNUT is holding above a horizontal support level around 0.12–0.13 USDT, aligning with the divergence signal.
Vo

See all ideas
Summarizing what the indicators are suggesting.
Oscillators
Neutral
SellBuy
Strong sellStrong buy
Strong sellSellNeutralBuyStrong buy
Oscillators
Neutral
SellBuy
Strong sellStrong buy
Strong sellSellNeutralBuyStrong buy
Summary
Neutral
SellBuy
Strong sellStrong buy
Strong sellSellNeutralBuyStrong buy
Summary
Neutral
SellBuy
Strong sellStrong buy
Strong sellSellNeutralBuyStrong buy
Summary
Neutral
SellBuy
Strong sellStrong buy
Strong sellSellNeutralBuyStrong buy
Moving Averages
Neutral
SellBuy
Strong sellStrong buy
Strong sellSellNeutralBuyStrong buy
Moving Averages
Neutral
SellBuy
Strong sellStrong buy
Strong sellSellNeutralBuyStrong buy
Displays a symbol's price movements over previous years to identify recurring trends.