POWR/BTC long entryPower is still in a correction. Investors EMA are still in expansion for a bearish trend. RSI also show weakness, no momemtum.
I would start building a long entry between 0.00003900-0.00003500 and place some bids around 0.00003000 hoping to catch some knives.
POWRBTC trade ideas


powr in big support i thank will up 20 % buy @ 0.000042 - 0.00004450
price now 0.00004450
sell
0.000047 - 0.0000495 - 0.000054 - 0.000059 +
risk 65 %
stop 0.000040


#POWR daily or every other day swing tradesPower Ledger #POWR is showing a pattern of constant swing trade ability.
The chart is my take on the buy/sell/long sell and support points.


$POWR easy 3x #cryptcurrency #bitcoin #ripple #binance Very sweet spot for POWR. I'll load a bit here. Might get dipper and I will be ready then too
Power ledger near long term trend lineLets see if it an find support at this key level.
P.S. This is not a financial advise, just sharing some thoughts

Power Down The Star Ship — No Warp Drive For POWR/BTC Just Yet. Hi friends, and congratulations to my Twitter followers, who voted POWR, and won this week's #CoinVote! Welcome to this brand new, straight outta the box, fresh outta the package analysis on Power Ledger! Let's get it! Looking at the four hour chart, for POWR/BTC, we can see that Power has been in a downtrend channel (in pink) since the all time high. Recently, Power broke below the 78.6% retrace, and has been failing to get back above. Additionally, the 20 EMA (in blue) has been acting as resistance for quite some time. Power recently rallied above the 20 EMA, but was rejected just above, at the 50 EMA (in orange.) So, we can see that the falling resistance levels have been putting the rally attempts in check. Looking at the midline of the channel, you can see that Power has been flirting with it for about the past two weeks. Currently, POWR/BTC is just above, but the overall trading in the top half of the channel is weak and infrequent, compared to the trading in the bottom half.
So let's recap. We have apparent weakness in the top half of the channel, we've broken below the 78.6% retrace, the moving averages continue to provide overhead resistance, and we're in the midst of a downtrend channel. With all of those things in mind, you can see that the overall picture is bearish.
However, on the MACD, we do have a bullish divergence that is developing. With that said, I don't generally read too much into MACD divergences. As a lone indicator, they can be very misleading. However, they do show us that the underlying sell-side pressure is dwindling, as the market continues to make lower lows. With that said, the volume is practically nonexistent, so, again, I wouldn't read too much into it at this point. Since the sell side pressure is dwindling, it's important to keep an eye out for any reversal signs, like a break above the 50 EMA, for example. That's a development that, combined with the bullish divergence, could present some nice upside. However, until a reversal signal emerges, I would just keep the divergence in mind.
The overall bias is still to the downside, so let's discuss the downside support levels. You can see that there is a bit of support off of the highs on the left side of the chart, at about 4546. Below there, the support is sporadic and insignificant. Therefore, a sustained breakdown below 4546, could cause Power to fall significantly lower, potentially all the way down to the 2613 level. With that said, it's important to keep in mind that we are in the middle of a downtrend channel. The trend is CLEARLY down — lower highs and lower lows, and there aren't any real indications of strength at the moment. Until Power starts to print some higher highs and lows, the trend will remain to the downside. The trend is your friend, people! Know that, own it, cuddle up to it at night, and never forget it. That is a motto that has protected me as an investor, on countless occasions. Until the trend reverses, the trend is your friend.
This has been your not-so-humble market wizard, droppin' knowledge like bombs in this place! Please follow, comment, like, and share on social media. Good luck trading everyone!
***This information is not a recommendation to buy or sell. It is to be used for educational purposes only.***
-Magic loves you-
-JD-

PowerLedger POWR/BTC - Let's catch some butterfliesThere is no butterfly formation just yet, but it looks like a good possibility. This trade idea is just for fun, I'm not in until I see it bouncing off support and reversing current minor trend.

PowerLedger Prime & Ready
RSI is in the oversold area.
As we can see a falling wedge as well.
Buy in at the breakout of the wedge.
MACD is about to turn
Price bounced off a major support

POWR In My Sights...PowerLedger is an ultra long. Difficult to count and get a handle but the market is showing us a course. There definitely has been a shift in sentiment in the crypto markets lately. I don't know why. But if someone could show me some TA explaining the psychological point of each swing I'd appreciate it.
Anyway revert to chart. 4hr seems to have been the clearest in my eyes for TA. But I do look at all timetables.
No new advancements but time for a new chart due to the shift in sentiment.
--longmoney

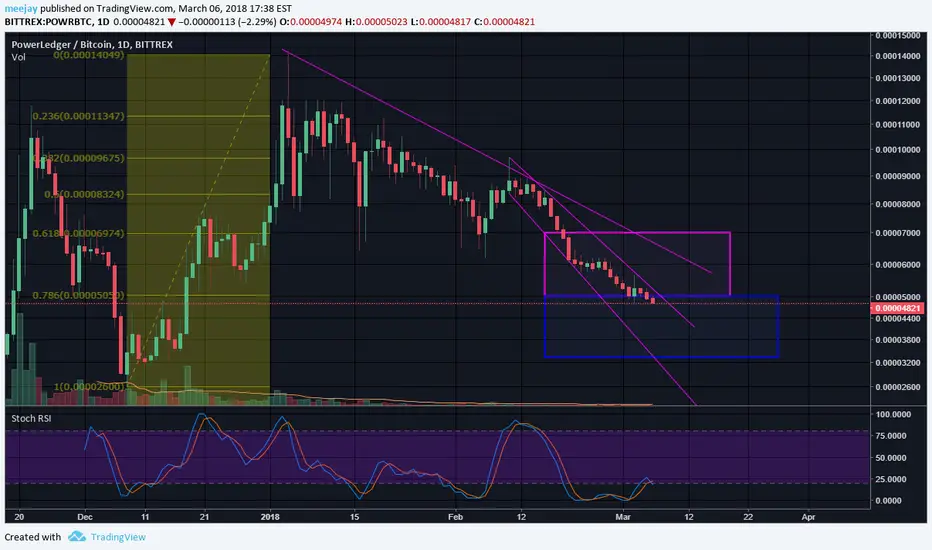
Power Ledger (POWR) - breakout?Going thrue Binance coins i just noticed something interesting. Play it smart, watch out for BTC ride! Remember that Fib Retracement points might work as resistance - these are the possible targets.
The breakout was notice at 0.786 Fibo so technically it looks perfect.


POWR ripe for pickingStarting to accumulate a position and expecting a slip if bitcoin decides to dip but still filling up my bags.

Great opportunity to long POWRBTC, March 3rd.A huge divergence pattern is formed.
I think the second Fib level is within arm's reach.

March 3, POWRBTC, great opportunity to go long with a great coinGreat divergence pattern. Great opportunity to go long.


Power Ledger #POWR RSI oversoldCoin hasn't been around long enough to confirm real support/resistances, or at least numbers I am confident spitting out.
It may catch support at 5k, 4.5k or lower, but the RSI is oversold, so it should rebound in the next week.
We will have to wait and see exactly where it finds support, and gains some volume ++price action.

POWR POWR...Who Can MasterHere is an updated chart on POWR as it has been a while. For now I have marked off wave 1 high from previous completion. Checking for target buy zones. I am long but this chart is messy. IF you're super long then you have no worries lol.
Education purposes only.
Updates soon...
--longmoney

POWR/BTC possible short-term trend reversalI'm looking for a short-term bounce since RSI adheres from the previous over-sold indicator plus it is approaching the support levels I've mapped. However, MACD is just merely showing a buy signal (but it's going there).


POWR BTC bittrex short long possible scenario wich can happen , huge price correction behind us and the support start to react to keep market up , so i think it would not drop more without any fud, ^^ i will keep my idea updated so gl hf ^^
