SAZEW - Buy Call for Long-term holdingSAZGAR ENGINEERING WORKS, fundamentally is very promising.
Its share price is in the bull run since April 2024 and after recent retracement gas again started its bull run w.e.f. 05 Nov 2024.
Technically a Flag and Pole pattern has been drawn and replicated to arrive to subsequent TP values. Trend based Fib Ext tool has also been used to draw the confluence as TPs are falling near to key Fib values.
Current bull run will see the prices touching PKR 1910~1930 zone by March 2025 or latest by first week of April 2025 (giving 70% gain) . Then after profit booking prices may retrace to form a Higher Low in order to gear-up for another bull run by end May 2025 which will see prices touching TP-2 (PKR 2580~2600) by end Oct 2025 (giving overall 131% gain).
Buy:116 (instant)
SL: 903 (below HL)
TP 1: 1924 expected in March/April 2025
TP2: 2588 expected in October 2025
SAZEW trade ideas

old analysis played well As mentioned in last analysis, it successfully
touched 1050 after sustaining 955.
Now it is near Immediate Resistance area.
Currently, it is moving in a range from around
930 - 1050
Sustaining 1065 may lead it towards 1100+
On the flip side, 930 is a very Important Support.

Sazew resistance 1038 is very importantSazew current financial results are good and these levels could be crossed by #Sazew, Important resistance level is 1038, and it could touch these above levels.
Note: This is not a buy or sell call, Trade at your own risk and decisions.

It is important to Sustain 955 for now, It is important to Sustain 955 for now, if it is
sustained, we may witness its immediate
resistance around 1020 - 1050.
Next Support seems to be around 830 - 850 &
then around 800 - 803.

SAZEW | Bearish Flag PatternThis chart is for Sazgar Engineering Works Limited (SAZEW) on the Pakistan Stock Exchange (PSX). Here’s a breakdown of the analysis:
Bearish Flag Pattern:
The chart highlights a "Bearish Flag Pattern." This pattern is typically a continuation pattern seen in a downtrend, where the price consolidates before continuing its downward move. It suggests potential weakness in the stock price.
Support Level at 860 PKR:
There is a significant support level marked at 860 PKR. If the stock price breaks through this level, it could trigger further declines. Support levels are key price points where demand could potentially increase, preventing further drops.
Price Action:
The price is currently around 965 PKR (as of the chart date), and the stock has been in a slight downtrend. The bearish flag indicates that after a small consolidation, a drop could happen, possibly to test the support at 860 PKR.
Possible Rebound:
The chart suggests a potential rebound from the support level. If the price successfully tests and holds at 860 PKR, a recovery might occur, as indicated by the upward curve. However, if the stock breaks below the support, it could signal a bearish continuation.
Overall Outlook:
Short-term trend: Bearish, as suggested by the flag pattern.
Critical level: The 860 PKR support level. A break below it could lead to further declines, while holding it could signal a potential reversal or bounce.

SAZEW- LONG Trade CallLONG (Buy) Trade Call
Technical Analysis: Entry: On crossing Flag's Upper Resistance Level which will likely indicate a start of bull run. This is the safest approach to enter once bull run is confirmed. On the flip side of it comes Mr. Fibonacci - who gave us Fibonacci Equation. And over the past 4 decades now it is norm to consider Fib retracement for getting better entry prices. As per Fibonacci principal, Fib retracement value 0.236 (Rs 963) is tested 85% of the time before going back to the original trend direction, Fib 0.382 (820.80) 70% tested which is likely to happen around 11 Oct 2024. And if market sentiments go down then it can even touch Fib 0.618 (Rs 588.79) 30% chances.
Fundamental Analysis are very much in Favour as well.
Therefore, place Buy Orders according to your own best judgment. I'll personally take entry on either breaking of Flag's Upper resistance OR at Fib 0.382 (Rs 820).

Sazgar Future Prediction - Advanced AnalysisBased on current trends and market analysis, it is predicted that Sazgar will experience a decline till R 927. Following this, there are two possible scenarios:
Scenario 1: Trend Reversal (60% probability)
The stock will experience a trend reversal, indicating a potential change in direction.
Scenario 2: Further Decline (40% probability)
The stock will continue to drop, potentially reaching R 861. This level is considered a buying opportunity, as it may represent a bottoming out of the stock's value.
Give Bost for More Analysis

Bearish Divergence on Daily TF but..Bearish Divergence on Daily TF may
put some pressure on price, but still it
is Bullish on Monthly TF.
However, it would continue its Bullish Momentum
only if it crosses and sustain 1210.
On the flip side, as mentioned in last analysis,
immediate supports can be around 927 & then
around 830 - 850.

Still Bullish on Bigger TF but.. but Bearish
Divergence has appeared.
Important to Sustain 1032 - 1035
for an Upside move.
If this level is Not Sustained, Next Lower
Levels 927 & 863 will be exposed.

Potential Support Zone??Slight Bullish Divergence on Hourly TF.
If Current Level is Broken, we may witness
the Next Support Zone.

SAZEW | Bullish Pennant PatternSAZEW printed a bullish pennant pattern with no sign of divergence. A bullish trend continuation is expected, entry is suggested at 700 with the stop loss below previous lower high level at 650. Previous top of 782.50 considered as TP1 and after the break out it can leads towards the completion of pennant pattern, the price can projected towards 1,000.

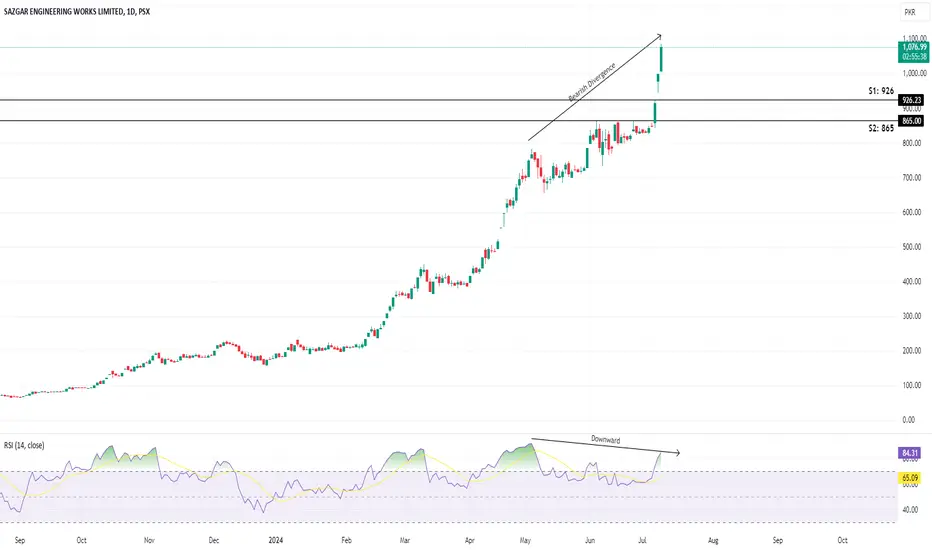
SAZEWBearish divergence is observed in *SAZEW*, RSI indicator is at 84 which indicated price is overbought, first support lies around 926 and secondary support lies around 865. Can be consider on support levels in 2 step.
SAZEW - Bearish Divergence in play on Daily Time FrameBearish divergence is in play on the daily time frame, and the price is expected to retrace up to 650 before moving upward.
Let's see how it plays out in the next few days.

Analysis Shared on 16-05-2024 played really well.Analysis Shared on 16-05-2024 played really well.
It Touched 785 exactly. As mentioned earlier, we
may see Trend Continuation now if the Current Level
is Sustained with Target around 1000+

Bullish on Bigger Time Frames.
However, if 655 is broken, we may witness
600 then 575.
On the flip side, important to break 765
to Hit 785 and if 785 is Crossed, we may see
trend continuation.

SAZEW (ANALYSIS).SAZEW forms a bullish flag pattern with a target price of 805, currently heading towards that level. RSI shows no divergence on the daily timeframe but does on shorter timeframes (1hr, 2hr). ADX indicates overbought conditions, advising caution.
Trading Recommendation:
Consider long positions cautiously, with lower quantities due to RSI divergences and overbought ADX. Monitor the target price closely and implement professional risk management strategies.

SAZEW (ANALYSIS) .📈 Market Update: SAZEW
Current Scenario:
SAZEW is giving all breakouts and heading towards the channel top at 611.
Technicals have been relatively quiet, but RSI is now extremely bullish and in an overbought situation.
There's also an exceptionally large gap between 518-555.
Trade Strategy:
Action: Consider selling 40-50% at 590-612.
Stay alert and flexible in your trading! 📊💼

Sazew (Intraday/short Swing) BuyExtremely Bullish + breakout given at 450 so low Risk High Reward.
Buy Sazew at 480 - 493.
sell at 498 , 512 , 530.
Sl Below 480.

go long in sazewgo long in sazew , sazew in side ways position but gradually moving towards 500 so buy and sell at 500 +

340 - 345 seems to be an Important ResistanceWEEKLY Analysis:
340 - 345 seems to be an Important Resistance
However, there is No Bearish Divergence Yet on
Weekly TF
and if this level (345) is sustained, we may witness 400+

Re-test of Breakout Level possible around 233 Bullish on Weekly as well as Monthly TF
Re-test of Breakout Level possible around 233

Bullish on Weekly as well as Monthly TF
Plan1
Buy1 around 204 - 207
Buy2 around 193 - 195
TP(1) around 212 - 214
TP(2) around 225 - 228
Stoploss 188 (Closing basis)
Plan2
Buy Above 215
Sell around 220-223 , then 230
Stoploss 203 (closing basis)

SAZEWPlan1
Buy1 around 203
Buy2 around 193 - 195
TP(1) around 212 - 214
TP(2) around 225 - 229
Stoploss 188 (Closing basis)
Plan2
Buy Above 233
Sell around 245 , then 260
Stoploss
