Pundi X: What One Does, The Rest Follows!Pundi X is growing more than 70% in a single day and more than 140% since the 7-April bottom low, this is what will happen with all the Altcoins.
Notice the chart pattern, it is the same as all the others we've been looking at in the past three weeks.
» A strong bullish wave starts November 2024 a

PUNDIX break below the significant bullish order block confluence around $0.4328 confirms bearish continuation. The immediate targets are the sell-side liquidity pools below the current price. Any rallies should be viewed with caution as potential opportunities to short, given the prevailing downtrend and
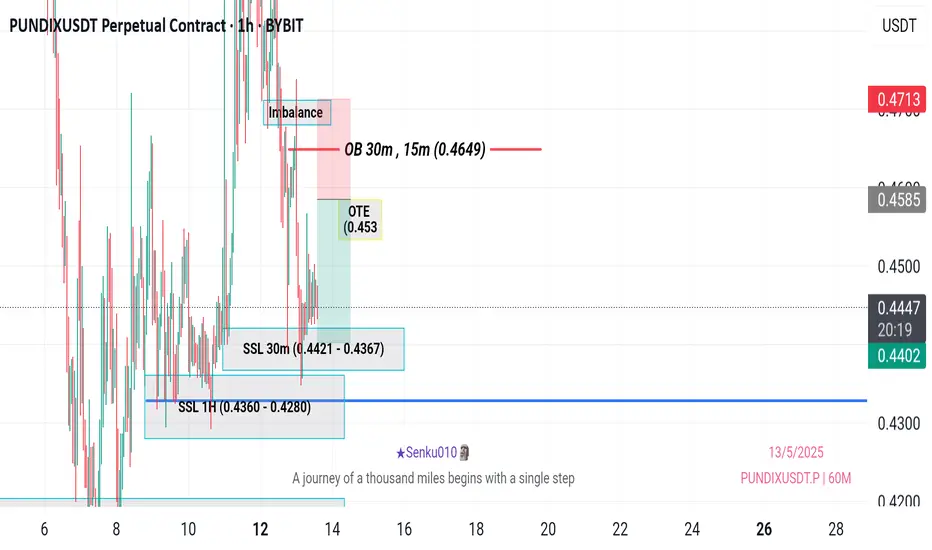
PUNDIX/USDTKey Level Zone: 0.4520 - 0.4570
HMT v8.1 detected. The setup looks promising, supported by a previous upward/downward trend with increasing volume and momentum, presenting an excellent reward-to-risk opportunity.
HMT (High Momentum Trending):
HMT is based on trend, momentum, volume, and market str

PUNDIXUSDT 1DPUNDIX ~ 1D Analysis
#PUNDIX Buy after successfully penetrating the resistant line of this pattern with a short -term target of at least 10%+.

PUNDIX // head and shoulders formationAlthough there is a reverse head and shoulders formation on the chart, the targets are drawn according to Fibonacci.Let's look for closures above the blue line.

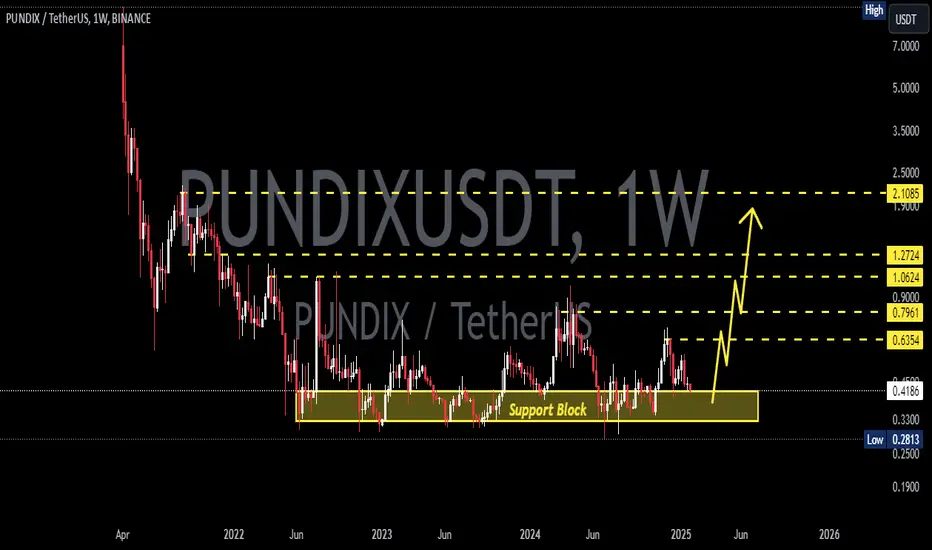
PUNDIXUSDT 1WPUNDIX ~ 1W Analysis
#PUNDIX This is the lowest support block for now. Buy from here if you still have a Conviction on Coin. with a minimum target of 20%+.

PUNDIXUSDT 1WPUNDIX ~ 1W Analysis
#PUNDIX So far it still maintains this support block. Buy from here if you still have a Conviction on this coin with a minimum target of 20%+
pundixthis is long term trade, so it needs time and consider the stoploss in case it does not playout

PUNDIX Hi, the coin looks promising!
There was a descending channel, which has now been broken, followed by the formation of an ascending triangle.
with 15 days of consolidation, the pattern target is $0.56 (12%)
The second target is the previous resistance at $0.62 (25%)
The stop loss hasn’t been set yet

PundiX Super Easy Targets (500% Or Higher In 2025)This is another Cryptocurrency trading pair that has been consolidating —sideways— since May/June 2022, for 2.5 years.
A very long consolidation phase. A very strong support has been created. A strong base. From this strong base, a strong advance can develop anytime now. We are talking about days o

See all ideas
Summarizing what the indicators are suggesting.
Oscillators
Neutral
SellBuy
Strong sellStrong buy
Strong sellSellNeutralBuyStrong buy
Oscillators
Neutral
SellBuy
Strong sellStrong buy
Strong sellSellNeutralBuyStrong buy
Summary
Neutral
SellBuy
Strong sellStrong buy
Strong sellSellNeutralBuyStrong buy
Summary
Neutral
SellBuy
Strong sellStrong buy
Strong sellSellNeutralBuyStrong buy
Summary
Neutral
SellBuy
Strong sellStrong buy
Strong sellSellNeutralBuyStrong buy
Moving Averages
Neutral
SellBuy
Strong sellStrong buy
Strong sellSellNeutralBuyStrong buy
Moving Averages
Neutral
SellBuy
Strong sellStrong buy
Strong sellSellNeutralBuyStrong buy
Displays a symbol's price movements over previous years to identify recurring trends.