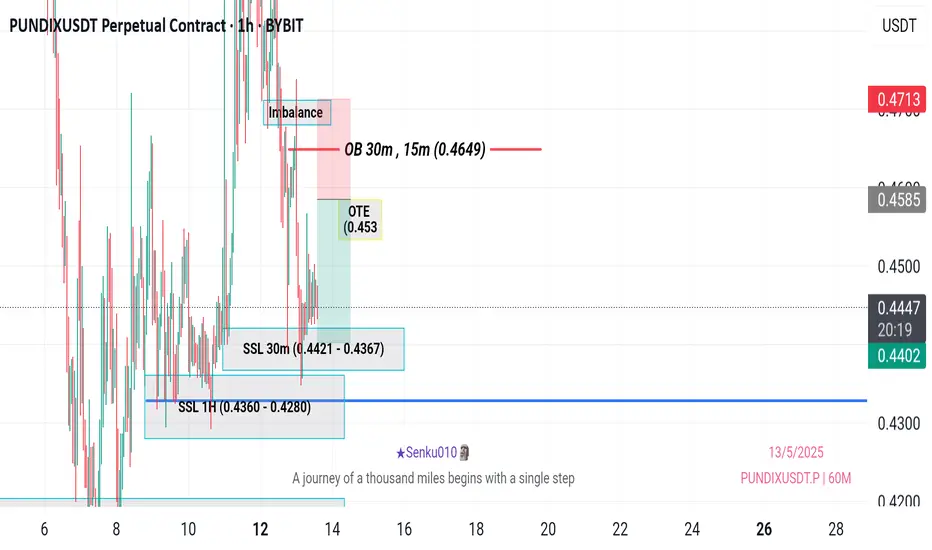
PUNDIX/USDTKey Level Zone: 0.4520 - 0.4570
HMT v8.1 detected. The setup looks promising, supported by a previous upward/downward trend with increasing volume and momentum, presenting an excellent reward-to-risk opportunity.
HMT (High Momentum Trending):
HMT is based on trend, momentum, volume, and market structure across multiple timeframes. It highlights setups with strong potential for upward movement and higher rewards.
Whenever I spot a signal for my own trading, I’ll share it. Please note that conducting a comprehensive analysis on a single timeframe chart can be quite challenging and sometimes confusing. I appreciate your understanding of the effort involved.
Important Note :
Role of Key Levels:
- These zones are critical for analyzing price trends. If the key level zone holds, the price may continue trending in the expected direction. However, momentum may increase or decrease based on subsequent patterns.
- Breakouts: If the key level zone breaks, it signals a stop-out. For reversal traders, this presents an opportunity to consider switching direction, as the price often retests these zones, which may act as strong support-turned-resistance (or vice versa).
My Trading Rules
Risk Management
- Maximum risk per trade: 2.5%.
- Leverage: 5x.
Exit Strategy
Profit-Taking:
- Sell at least 70% on the 3rd wave up (LTF Wave 5).
- Typically, sell 50% during a high-volume spike.
- Adjust stop-loss to breakeven once the trade achieves a 1.5:1 reward-to-risk ratio.
- If the market shows signs of losing momentum or divergence, ill will exit at breakeven.
The market is highly dynamic and constantly changing. HMT signals and target profit (TP) levels are based on the current price and movement, but market conditions can shift instantly, so it is crucial to remain adaptable and follow the market's movement.
If you find this signal/analysis meaningful, kindly like and share it.
Thank you for your support~
Sharing this with love!
HMT v2.0:
- Major update to the Momentum indicator
- Reduced false signals from inaccurate momentum detection
- New screener with improved accuracy and fewer signals
HMT v3.0:
- Added liquidity factor to enhance trend continuation
- Improved potential for momentum-based plays
- Increased winning probability by reducing entries during peaks
HMT v3.1:
- Enhanced entry confirmation for improved reward-to-risk ratios
HMT v4.0:
- Incorporated buying and selling pressure in lower timeframes to enhance the probability of trending moves while optimizing entry timing and scaling
HMT v4.1:
- Enhanced take-profit (TP) target by incorporating market structure analysis
HMT v5 :
Date: 23/01/2025
- Refined wave analysis for trending conditions
- Incorporated lower timeframe (LTF) momentum to strengthen trend reliability
- Re-aligned and re-balanced entry conditions for improved accuracy
HMT v6 :
Date : 15/02/2025
- Integrated strong accumulation activity into in-depth wave analysis
HMT v7 :
Date : 20/03/2025
- Refined wave analysis along with accumulation and market sentiment
HMT v8 :
Date : 16/04/2025
- Fully restructured strategy logic
HMT v8.1 :
Date : 18/04/2025
- Refined Take Profit (TP) logic to be more conservative for improved win consistency
PUNDIXUSDT.P trade ideas

PUNDIX/USDTKey Level Zone: 0.4520 - 0.4570
HMT v8.1 detected. The setup looks promising, supported by a previous upward/downward trend with increasing volume and momentum, presenting an excellent reward-to-risk opportunity.
HMT (High Momentum Trending):
HMT is based on trend, momentum, volume, and market structure across multiple timeframes. It highlights setups with strong potential for upward movement and higher rewards.
Whenever I spot a signal for my own trading, I’ll share it. Please note that conducting a comprehensive analysis on a single timeframe chart can be quite challenging and sometimes confusing. I appreciate your understanding of the effort involved.
Important Note :
Role of Key Levels:
- These zones are critical for analyzing price trends. If the key level zone holds, the price may continue trending in the expected direction. However, momentum may increase or decrease based on subsequent patterns.
- Breakouts: If the key level zone breaks, it signals a stop-out. For reversal traders, this presents an opportunity to consider switching direction, as the price often retests these zones, which may act as strong support-turned-resistance (or vice versa).
My Trading Rules
Risk Management
- Maximum risk per trade: 2.5%.
- Leverage: 5x.
Exit Strategy
Profit-Taking:
- Sell at least 70% on the 3rd wave up (LTF Wave 5).
- Typically, sell 50% during a high-volume spike.
- Adjust stop-loss to breakeven once the trade achieves a 1.5:1 reward-to-risk ratio.
- If the market shows signs of losing momentum or divergence, ill will exit at breakeven.
The market is highly dynamic and constantly changing. HMT signals and target profit (TP) levels are based on the current price and movement, but market conditions can shift instantly, so it is crucial to remain adaptable and follow the market's movement.
If you find this signal/analysis meaningful, kindly like and share it.
Thank you for your support~
Sharing this with love!
HMT v2.0:
- Major update to the Momentum indicator
- Reduced false signals from inaccurate momentum detection
- New screener with improved accuracy and fewer signals
HMT v3.0:
- Added liquidity factor to enhance trend continuation
- Improved potential for momentum-based plays
- Increased winning probability by reducing entries during peaks
HMT v3.1:
- Enhanced entry confirmation for improved reward-to-risk ratios
HMT v4.0:
- Incorporated buying and selling pressure in lower timeframes to enhance the probability of trending moves while optimizing entry timing and scaling
HMT v4.1:
- Enhanced take-profit (TP) target by incorporating market structure analysis
HMT v5 :
Date: 23/01/2025
- Refined wave analysis for trending conditions
- Incorporated lower timeframe (LTF) momentum to strengthen trend reliability
- Re-aligned and re-balanced entry conditions for improved accuracy
HMT v6 :
Date : 15/02/2025
- Integrated strong accumulation activity into in-depth wave analysis
HMT v7 :
Date : 20/03/2025
- Refined wave analysis along with accumulation and market sentiment
HMT v8 :
Date : 16/04/2025
- Fully restructured strategy logic
HMT v8.1 :
Date : 18/04/2025
- Refined Take Profit (TP) logic to be more conservative for improved win consistency

PUNDIX break below the significant bullish order block confluence around $0.4328 confirms bearish continuation. The immediate targets are the sell-side liquidity pools below the current price. Any rallies should be viewed with caution as potential opportunities to short, given the prevailing downtrend and overhead resistance.
Pundi X: What One Does, The Rest Follows!Pundi X is growing more than 70% in a single day and more than 140% since the 7-April bottom low, this is what will happen with all the Altcoins.
Notice the chart pattern, it is the same as all the others we've been looking at in the past three weeks.
» A strong bullish wave starts November 2024 and ends December 2024.
» The end of this bullish wave marks the start of a strong correction.
» This correction ends up producing a lower low compared to the start of the previous bullish wave. (Some pairs are producing higher lows —the stronger ones.)
» This low or higher low ends up happening exactly on the 7th of April.
» The session that produced the low has either low bearish volume or ended up closing green.
» Trading volume starts to rise after this major low with a small recovery and then...
» A massive bullish jump, a strong breakout to market the start of the next bull market phase.
Most of the Altcoins are producing the exact same fractal, same price dynamics and chart patterns. All that is left, is for the bullish breakout. We will see hundreds of pairs moving up at the same time in the coming days. May is just around the corner, this is the month when everything will grow.
Are you ready?
Thank you for reading.
Namaste.

PUNDIXUSDT 1DPUNDIX ~ 1D Analysis
#PUNDIX Buy after successfully penetrating the resistant line of this pattern with a short -term target of at least 10%+.

PUNDIX // head and shoulders formationAlthough there is a reverse head and shoulders formation on the chart, the targets are drawn according to Fibonacci.Let's look for closures above the blue line.

PUNDIXUSDT 1WPUNDIX ~ 1W Analysis
#PUNDIX This is the lowest support block for now. Buy from here if you still have a Conviction on Coin. with a minimum target of 20%+.

PUNDIXUSDT 1WPUNDIX ~ 1W Analysis
#PUNDIX So far it still maintains this support block. Buy from here if you still have a Conviction on this coin with a minimum target of 20%+
pundixthis is long term trade, so it needs time and consider the stoploss in case it does not playout

PUNDIX Hi, the coin looks promising!
There was a descending channel, which has now been broken, followed by the formation of an ascending triangle.
with 15 days of consolidation, the pattern target is $0.56 (12%)
The second target is the previous resistance at $0.62 (25%)
The stop loss hasn’t been set yet because the pattern is still in progress.
For now, we’re keeping an eye on the price action to see how things unfold.
BINANCE:PUNDIXUSDT HTX:PUNDIXUSDT COINBASE:PUNDIXUSDC GATEIO:PUNDIXUSDT CRYPTO:PUNDIXUSD

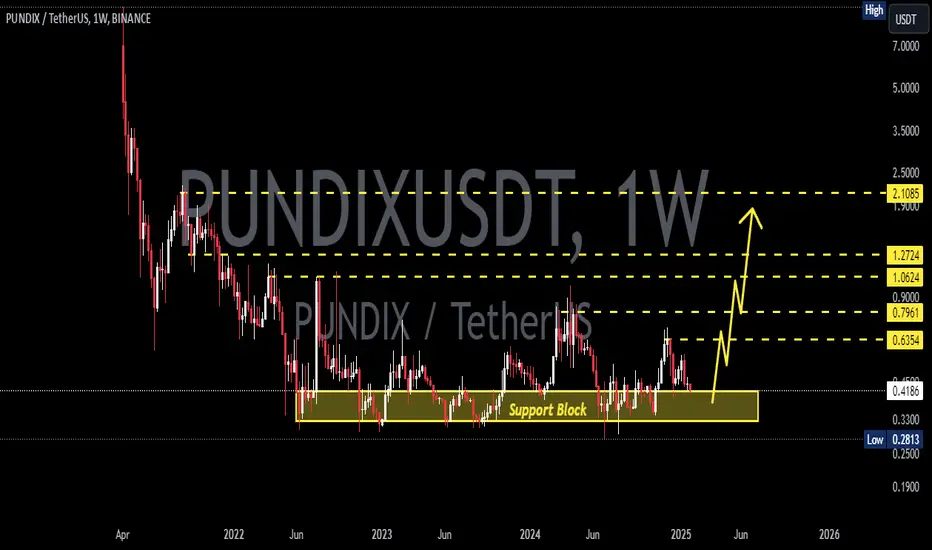
PundiX Super Easy Targets (500% Or Higher In 2025)This is another Cryptocurrency trading pair that has been consolidating —sideways— since May/June 2022, for 2.5 years.
A very long consolidation phase. A very strong support has been created. A strong base. From this strong base, a strong advance can develop anytime now. We are talking about days or weeks, maximum. We are no longer talking in terms of months but only weeks before we see green, green, green. High green.
Very easy targets on the chart starting with 200%. 359% and 511%. All these are easy because PundiX can reach much, much higher in the year 2025.
The bottom here came in early July 2024, a month before the rest of the market. In the same way, this pair can choose to start advancing a month before the rest of the market; it can happen.
Thank you for your continued support.
If you want to find the best Altcoins, just follow.
Namaste.

PUNDIXUSDT: HUGE OPPORTUNITY | %250 VOLUME SPIKEPUNDIXUSDT has recorded a 235% increase in trading volume over the past 24 hours, signaling growing activity.
🔵 Buying Zones: Possible demand zones are highlighted on the chart, designed to account for potential bearish scenarios in the broader crypto market by year-end.
📈 Entry Strategy: Avoid using these zones for entries on lower time frames unless confirmed by upward breakouts.
⚠️ Risk Reminder: Patience and caution are vital—wait for market confirmation before taking action.
Manage your trades carefully and stay prepared for volatility!
I keep my charts clean and simple because I believe clarity leads to better decisions.
My approach is built on years of experience and a solid track record. I don’t claim to know it all, but I’m confident in my ability to spot high-probability setups.
My Previous Analysis
🐶 DOGEUSDT.P: Next Move
🎨 RENDERUSDT.P: Opportunity of the Month
💎 ETHUSDT.P: Where to Retrace
🟢 BNBUSDT.P: Potential Surge
📊 BTC Dominance: Reaction Zone
🌊 WAVESUSDT.P: Demand Zone Potential
🟣 UNIUSDT.P: Long-Term Trade
🔵 XRPUSDT.P: Entry Zones
🔗 LINKUSDT.P: Follow The River
📈 BTCUSDT.P: Two Key Demand Zones
🟩 POLUSDT: Bullish Momentum
🌟 PENDLEUSDT.P: Where Opportunity Meets Precision
🔥 BTCUSDT.P: Liquidation of Highly Leveraged Longs
🌊 SOLUSDT.P: SOL's Dip - Your Opportunity
🐸 1000PEPEUSDT.P: Prime Bounce Zone Unlocked
🚀 ETHUSDT.P: Set to Explode - Don't Miss This Game Changer
🤖 IQUSDT: Smart Plan
⚡️ PONDUSDT: A Trade Not Taken Is Better Than a Losing One
💼 STMXUSDT: 2 Buying Areas
🐢 TURBOUSDT: Buy Zones and Buyer Presence
🌍 ICPUSDT.P: Massive Upside Potential | Check the Trade Update For Seeing Results

PUNDIX JACKPOT!So we have lose the trade deal in the last time , with ( -3%)
let's try again ;)
buy now
sell : 0.60 - 0.63 (25%)
stop : 4h close bellow 0.45 ( -12% )
BINANCE:PUNDIXUSDT

PUNDI X Some Targets (Signals)Pundi - we can see some bullish movement with this one as well. On smaller time frames.
On a weekly timeframe it looks very similar to other coins that may break out next 7days

PUNDIX bullspositive bullish Triangle
with 3 Days Accumilation
Support at 0.61/0.60
Buy :
Now !
or 1h close above 0.651
Sell : current resistance at 0.70 (12%)
or next resistance at 0.78 (24%)
Stop Loss : 1h close bellow 0.6050
BINANCE:PUNDIXUSDT HTX:PUNDIXUSDT MEXC:PUNDIXUSDT.P PHEMEX:PUNDIXUSDT BITGET:PUNDIXUSDT GATEIO:PUNDIXUSDT COINBASE:PUNDIXUSD CRYPTO:PUNDIXUSD

One Trade Per Day: Investment Opportunity with PUNDIX/USDTAs mentioned earlier, the upcoming period marks a significant inflow of capital into Altcoins. This shift is driven by profit-taking from Bitcoin’s downward adjustments and from Altcoins that have already mirrored Bitcoin’s upward trajectory.
Why Choose PUNDIX?
PUNDIX presents a strong opportunity for capital allocation, supported by its D1-W structure. The current D1 chart indicates a correction phase, setting the stage for further upward momentum.
Trend Direction: D1-W-M (Daily-Weekly-Monthly upward trend)
Entry Range: $0.54–$0.60
Status: Awaiting confirmation signal from the Rainbow MG3 indicator
Trading Method: Spot
PUNDIX stands out as a promising Altcoin with its technical structure and potential for growth. Keep a close watch for confirmation signals to maximize investment timing!

Pundix/USDT1. Overview:
Current Situation:
The price seems to be consolidating after testing previous horizontal resistance levels.
It is currently testing the descending trendline.
2. Key Levels:
Support Levels:
0.5542: Acted as a reversal zone before; a critical support level.
0.4482 and 0.3436: Important supports in case of further downside pressure.
Resistance Levels:
0.6384 - 0.6400: Price is currently facing resistance at this level.
0.6925: If broken, the price might rally toward this level.
0.7560: A strong horizontal resistance; breaking this confirms a bullish trend continuation.
3. Trendline and Possible Breakout:
The descending trendline (dashed line) is pressuring the price downward. A breakout above this trendline may signal bullish momentum.
4. Bollinger Bands:
Bollinger Bands indicate the price is at the upper edge, suggesting current resistance. A breakout could lead to increased volatility.
5. Scenarios:
Bullish Scenario:
The price breaks the descending trendline and targets 0.7560.
Bearish Scenario:
If the current resistance holds, the price may drop toward 0.5542 and subsequently to 0.4482.

Pundi X Long-Term Accumulation Zone & All-Time Low (657% Target)Pundi X is trading within an accumulation zone that is now more than 2.5 years old...
I hope this day is treating you well... Let's go straight to the analysis.
➖ PUNDI X vs Tether (USDT)
While a new All-Time Low has been hit recently, it is only a technicality. The ATL that was hit recently, in July 2024, is the same level that PUNDIXUSDT tested in May 2022, June 2022, November 2022 and December 2022; In June, August and September 2023, and recently in August 2024. As you can see, this is a very strong support level because all of the time it has been tested it continues to hold.
The ATL in July 2024 happened on a wick, the session close was much, much higher. In fact, the close was higher than all the mentioned lows since June 2022. This all translates into "long-term consolidation" or, we can call it a "long-term accumulation zone." Each time there is strong sellers into support, buyers are ready and waiting to buy everything up. That is why all the candles near this level has a long lower wick (strong buying).
The fact that this zone has been active and valid for so long opens the door for massive growth in 2025. More than two years of consolidation is a very long time in Cryptocurrency terms, and this gives strength to the buyers for the next bullish market phase.
We are looking at 468% to 657% potential for growth as shown on the chart, if we get a weak or medium-sized wave. There is potential for a new All-Time High also. Anything can happen... to the upside.
Remain open to, "it all turned out better than expected."
Thank you for reading.
Namaste.


PUNDIXUSDT IDEA WEEKLY TIMEFRAMEBINANCE:PUNDIXUSDT
Pundix Usdt weekly time frame bullish bottom out.
I think it will blast upto 150% 200%.
NOT A FINANCIAL ADVISE DYOR

PUTechnical Analysis of PUNDI X Breaking Trendline
Overview
The provided chart depicts the price action of PUNDI X (PUNDIX), highlighting a significant trendline break. The chart includes various technical indicators such as moving averages and Fibonacci retracement levels, which will be utilized in this analysis to understand the implications of the trendline break.
Trendline Analysis
Trendline Break: The chart shows a clear upward trendline that has been respected multiple times in the past. Recently, PUNDIX has broken above this trendline, which could signal a potential bullish reversal or continuation of an upward trend.
Volume: Observing the volume during the breakout is crucial. An increase in volume during the trendline break typically confirms the strength of the breakout.
Moving Averages
200-day Moving Average (Blue Line): The price has crossed above the 200-day moving average, which is a significant bullish signal indicating long-term trend reversal.
50-day Moving Average (Green Line): The price is currently above the 50-day moving average, supporting the bullish momentum.
20-day Moving Average (Red Line): The price is also above the 20-day moving average, indicating short-term bullish strength.
Fibonacci Retracement Levels
The Fibonacci retracement levels plotted on the chart are essential for identifying potential support and resistance levels:
0.382 Level (0.4505): The price has surpassed the 38.2% retracement level, often seen as a strong bullish indicator.
0.5 Level (0.4691): The next resistance level, as indicated by the 50% retracement, will be critical in determining if the price can sustain its upward momentum.
0.618 Level (0.4877): Further resistance at the 61.8% retracement level. A break above this level would be a strong bullish signal.
0.786 Level (0.5142) and 1.0 Level (0.5480): These levels provide additional resistance points to watch.
Candlestick Patterns
Recent Candlesticks: The recent candlesticks show a strong bullish trend with long green bodies, indicating strong buying pressure. This further supports the validity of the trendline break.
Potential Scenarios
Bullish Scenario: If the price can maintain above the broken trendline and surpass key Fibonacci levels (0.5 and 0.618), we could see continued upward movement towards 0.5142 and beyond.
Bearish Scenario: If the price fails to hold above the trendline and falls below the 0.382 retracement level, it could retest lower support levels, potentially around the 0.236 level (0.4275) or the previous lows.
Neutral Scenario: The price may consolidate around the current levels, oscillating between the 0.382 and 0.5 Fibonacci levels before making a decisive move.
Conclusion
The break of the trendline in the PUNDIX chart, combined with the supportive moving averages and bullish candlestick patterns, suggests a potential bullish continuation. However, monitoring the key Fibonacci retracement levels and volume will be crucial in confirming the strength and sustainability of this breakout.

#PUNDIXUSDT GREEN SUPPORT BAND )It came up from the blue pattern and grew
Now it is in the pullback position of this pattern.
Currently, we have the green support band, which is a good support.
A strong return from this range may give a good profit.
So for now
we wait and wait for the green reaction to this bandwith a green candle

LONG PUNDIX BREAK-OUT 'Pundi X is open-source and has public and open specifications, utilizing a mobile contactless point-of-sale terminal called the XPOS to enable the use of cryptocurrency in retail. PUNDIX is the ecosystem's utility token and powers the network while supporting its economy'
*FOR SHORT TERM
On the 3D chart, after consolidating for some time, we can see that PUNDIX finally broke out and seems to want to continue the uptrend.
'*GOOD POTENTIAL ALSO FOR LONG, LONG TERM 💰...
As a personal experience, I have known about this project since the beginning of 2018, and it is one of my favorite coins that I accumulate and have patience with.
Pundix made 20x in June 2018 when it was listed on Binance.
And 50x in January-March at the beginning of the 2021 bull market
How will PUNDIX surprise us in 2024-2025? Time will tell.
Good Luck. #NFA #DYOR
