PYTH medium term is bearishBy examining the chart data, we found that PYTH has completed a large degree pattern. This pattern is related to wave A. This pattern has lasted for about 250 days.
It is expected that wave B is also a pattern of the same degree as wave A. It means about 200-250 days.
The supply range is the best range for sell/short positions.
Note that in order to take a position, one must have a trading setup and this is only a medium-term view for PYTH.
Closing a daily candle above the invalidation level will violate the analysis
For risk management, please don't forget stop loss and capital management
Comment if you have any questions
Thank You
PYTHUSDT.P trade ideas

PYTHUSDT ANALYSISPAIR : BYBIT:PYTHUSDT.P
Leverage: 5X
Direction: LONG 🔼
SL: HODL
TP: 0.3629
ANALYSIS:
Market Cypher B: 1D TF✅
Bull Bear Power: 5HR TF✅
Nearest Resistance: 0.3629
Nearest Support: 00.1800
⚠️#DYOR

PYTHUSDT ANALYSISPAIR : BYBIT:PYTHUSDT.P
Leverage: 5X
Direction: SHORT
if pyth taps this zone 0.3400 we migth get a huge short from there
follow for more signals, updates and ideas
ANALYSIS:
Market Cypher B: 1D TF✅
Nearest Resistance: 0.1800
Nearest Support: 0.3630
⚠️#DYOR

PYTHUSDT 1DPYTH ~ 1D
#PYTH Very confusing
Whether to buy or worry.
we will give a conclusion.
in a bull market all bearish patterns may be easy to validate or fail structurally.
Losing this Support Block will make this bearish Pattern real, or if SEED_DONKEYDAN_MARKET_CAP:PYTH manages to defend this Support Block, We will say this bearish Pattern will fail.

PYTH/USDTEasy to strategise a long position here, full reset presenting the holy jarmonic structure.

$Pyth Macro chartBuying zone : $0.32-0.25
🎯 Target 1 - $0.48
🎯 Target 2 - $0.8
🎯 Target 3 - $1.15
🎯 Final target - $1.72

PYTHUSDT.PWe do have a local uptrend here. Closest resistance which price would like to test is around 0,45. Will be looking closer for the next move as the price will reach it. Forwardly suppose, that it would like to retest the demand zone around 0,33.
DYOR

Alikze »» PYTH| Descending channel failure🔍 Technical analysis: Descending channel failure
- It has been moving in a downward channel in the 8H time frame and daily.
- Currently, with the failure of the channel roof, it is around the supply area and neck line.
- Therefore, in case of a negative reaction, it can be broken into the channel with pullback and touch the specified targets by maintaining the 0.29 area.
💎 Alternative scenario: In addition, if it stabilizes below the 0.29 area, it can retest the green box.
🛑 Targets: 0.39 - 0.44 and supply area or red box.
🟩 Support: 0.29
»»»«««»»»«««»»»«««
Please support this idea with a LIKE and COMMENT if you find it useful and Click "Follow" on our profile if you'd like these trade ideas delivered straight to your email in the future.
Thanks for your continued support.
Best Regards,❤️
Alikze.
»»»«««»»»«««»»»«««
OKX:PYTHUSDT

H&SBig token unlock coming in about 10 days.
Release of 2.13 billion PYTH tokens which is more then half of the PYTH total supply in circulation. This can ad some sell pressure on the token
Head & shoulder pattern with a target of $2.6


PYTH/USDTPYTH potential impulse suggesting by a double bottom, chart idea comes from a hint giving by a bro. hope it plays well. #ayor

PYTH LONGWe formed double bottom, on daily chart we brok down trend and we enter at CTB. stop loss below weekly double bottom.

PYTH: Potential for 3x Gain!#PYTH has recently broken above the resistance trendline and is showing potential for a decent rally toward the all-time high range.
Accumulation Range: $0.2754 to CMP
Target: $1 (300%)
Trade Signal: Spot
Holding Period: 3-4 months
Note: Accumulate every dip possible and do your own research before investing.
Trade safely.
Regards,
Team Dexter.

PYTHUSDT.1DUpon examining the PYTH/USDT daily chart, a comprehensive analysis reveals several technical patterns and indicators that guide my trading decisions.
Overview of Current Market Position:
The price of PYTH/USDT stands at $0.3482, reflecting a decrease of 1.94% from the previous session. This movement highlights a need for careful assessment of market dynamics and potential directional changes.
Trend Analysis:
The chart displays a predominantly bearish trend over the recent months, with the price now consolidating around the $0.2303 level, which acts as the immediate support (S1). This consolidation suggests a potential for either continuation of the bearish trend or a possible reversal if bullish signals emerge.
Support and Resistance Levels:
S1 at $0.2303: A critical support level which the price has recently tested and bounced off from, indicating some buying interest at this level.
R1 at $0.4209 and R2 at $0.5094: These levels serve as the primary and secondary resistance levels. Overcoming R1 would be a significant bullish signal, likely leading to increased buying activity towards R2.
Technical Indicators:
Relative Strength Index (RSI): Positioned at 44.52, the RSI is below the neutral 50 mark, suggesting a slight bearish momentum. However, it's close enough to the midpoint to warrant monitoring for any upward movement that might indicate increasing bullish sentiment.
Moving Average Convergence Divergence (MACD): The MACD line is marginally above the signal line, albeit very close, indicating a potential buildup in bullish momentum if the divergence increases. However, the overall near-zero histogram points to a market in balance, with neither bulls nor bears fully in control.
Strategic Trading Insights:
Considering the current market conditions and technical setup, my strategy would be cautiously optimistic. The recent bounce from S1 suggests a potential for further recovery if the market sentiment improves. I would look for a confirmed breakout above R1 ($0.4209) before considering a more bullish stance. A sustained move above this level could target R2 ($0.5094), particularly if accompanied by increasing trading volume and further bullish signals from RSI and MACD.
Conversely, a break below S1 would reaffirm the bearish trend, necessitating a reevaluation of holding positions and possibly considering short positions towards lower price targets.
Conclusion:
The PYTH/USDT trading pair presents a finely balanced scenario with pivotal points at S1 and R1, which will likely determine the next significant price movement. Traders should remain vigilant, using these technical levels and indicators as key guides in their trading decisions. Adapting strategies in response to clear signals from these indicators and market movements is essential for capitalizing on this volatile trading environment.

PYTHUSDT 1DPYTH ~ 1D
#PYTH Looks like a Confirmed Double Bottom pattern.
Make purchases in stages within this support Block. short term target of at least 15%+

$PYTH - At the end of the formation.Breakout for the huge Falling Wedge formation will lead the bullish movement.
Buy for midterm with target $0.7 - $0.8


PYTH Short setup UPDATE - July 6 2024Following previous call on July 3, stating that a drop to much lower levels is very likely, #PYTH had more than -22% drop and hit full TP. With 3X lev, it is some %60 profit.

PYTH/USDT: Holds a potential of 250% growth!Hello everyone, I’m Cryptorphic.
For the past seven years, I’ve been sharing insightful charts and analysis.
Follow me for:
~ Unbiased analyses on trending altcoins.
~ Identifying altcoins with 10x-50x potential.
~ Futures trade setups.
~ Daily updates on Bitcoin and Ethereum.
~ High time frame (HTF) market bottom and top calls.
~ Short-term market movements.
~ Charts supported by critical fundamentals.
Now, let’s dive into this chart analysis:
The PYTH/USDT pair is currently indicating a bearish trend within a descending triangle pattern. A breakout above the descending trendline could signal a bullish reversal with targets at the identified resistance levels. A potential move above the 50 MA and rising RSI for confirmation of a bullish trend.
On the other hand, a break below the lower support could indicate further downside risk.
Moving Averages: The 50 MA is a crucial resistance level for PYTH. A breakout above this moving average could signal a bullish shift.
Relative Strength Index: The RSI is gradually gaining momentum indicating a potential bullish shift.
Support and Accumulation range: $0.25 to $0.31.
Resistance and Targets:
~ T1: 0.4946 USDT
~ T2: 0.6739 USDT
~ T3: 0.8867 USDT
~ T4: 1.0978 USDT
DYOR. NFA.
Please hit the like button to support my content and share your thoughts in the comment section. Feel free to request any chart analysis you’d like to see!
Thank you!
#PEACE

PYTH NEW UPDATENow that we have more data on the chart, the PYTH scenario is clearer.
It seems to be completing a descending triangle which is now in wave D of this triangle.
Wave D appears to be a diametric.
From the red box, we expect the price to move towards the green range and then react to the green box.
For risk management, please don't forget stop loss and capital management
Comment if you have any questions
Thank You

PYTHUSDT BUY ! Pythusdt is on major support it can give us huge pump in next coming months we can go long from this level and target will be highs of each resistance

PYTH Short setup - July 3 2024PYTH (8H) possible Short setup:
Trigger would be crossing below 0.3043 level (8H close). Entry can be done in 1H timeframe during retest of the trigger level and SL would be just above the mentioned level. possible TPs for this setup would be: 0.2888 - 0.2741 - 0.2615 - 0.2463. Max leverage allowed is 3X

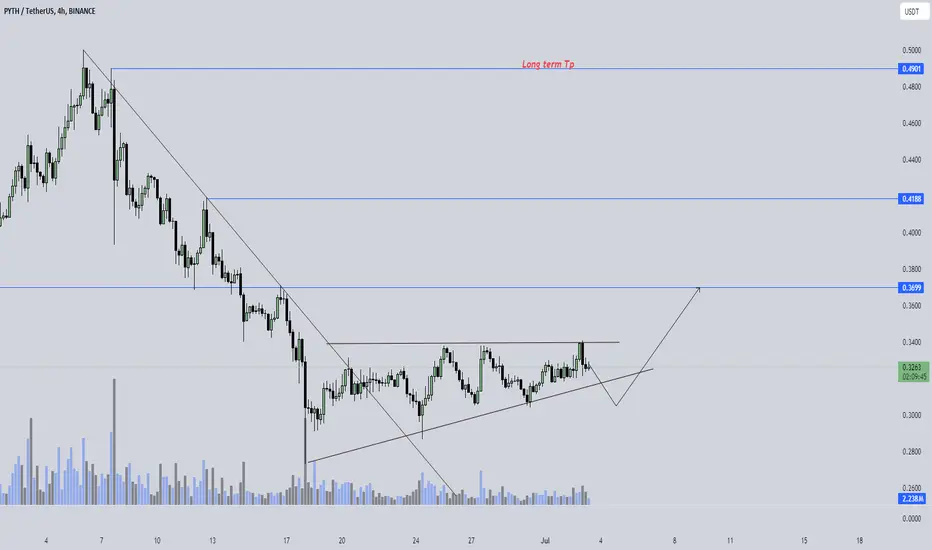
Pyth / UsdtBINANCE:PYTHUSDT
🔖 SEED_DONKEYDAN_MARKET_CAP:PYTH 🔖
✨Entry : 0.3250 - CMP✨
🎯Targets : 0.3650 - 0.3800 - 0.400..+🎯
❌SL : 11%❌
⚠️Disclaimer : I am not Financial Advisor (DYOR)...⚠️