PYTH Breaks Barriers , but Could Be Rejected By Resistance SoonOKX:PYTHUSDT went ballistic over the past 24 hours and was able to break through multiple resistance levels. As a result, it is now attempting to flip the resistance level at $0.7934 into support.
Technical indicators show that PYTH is deep within a short-term bullish cycle. Looking at the Exponential Moving Averages (EMA), the 9 EMA crossed above the 20 EMA, indicating a positive trend. This crossover suggests increasing buying pressure and potential upward momentum for the pair. However, it's essential to consider other indicators to validate this bullish sentiment.
The Moving Average Convergence Divergence (MACD) further supports the bullish outlook, with the MACD line consistently staying above the signal line. The histogram, representing the difference between the MACD and signal line, has been consistently positive, indicating strengthening bullish momentum.
On the other hand, the Relative Strength Index (RSI) recently reached overbought territory at 87.04, indicating potential overvaluation. This may be an early sign of a correction as downside potential for the Pyth Network price is currently greater than its upside potential, which is generally seen as a sell signal by traders.
Analyzing the support and resistance levels, we identify crucial thresholds for potential price movements. The support levels are observed at $0.6850, $0.6318, and $0.5782. These levels may act as barriers against further downward movements, providing opportunities for potential buying interest.
Considering potential entry and exit points for traders, long positions could be initiated if the the Pyth Network price remains above the 20-day EMA and closes a 4-hour candle above the resistance at $0.7934. In contrast, short positions could be considered if the price falls below the 9-day EMA and breaches support at $0.6850, with caution exercised around the support levels mentioned.
PYTHUSDT trade ideas

PYTHUSDT Buy Setup!PYTHUSDT Technical analysis update
PYTH price bro out its resistance line after repeatedly testing it.
Buy level: $0.585
Stop Loss:$0.56
Regards
Hexa

PYTH/USDT Accumulation completed.BYBIT:PYTHUSDT
This idea has a medium-term profit target.
All targets are indicated on the graph.
- Risk 1% on deposit
- R/R 1/2
P.S (This is not an investment recommendation, this is my personal opinion.)

PYTH buy/long setupFirst of all, note that this is not a sell/short setup, but a buy/long setup.
If the price reaches the green range, we will enter the buy/long position.
Closing a 4-hour candle below the invalidation level will violate the analysis
For risk management, please don't forget stop loss and capital management
Comment if you have any questions
Thank You

Harsi Gap explained from my PKPA indicatorIn this brief video I will explain how I look for what is called a HARSI GAP. It is when the Heikin Ashi RSI lines all converge into oversold or overbought territory. It will create an imbalnce for the RSI lines to come back to the mean and have price go through a rebalnce period.

#PYTH/USDT#PYTH
The bearish channel on the 1-hour frame was broken strongly to the upside
It is supported by a rebound from the green support area on the chart
This support area was adhered to well
Entry price is 0.5920
The first target is 0.6000
The second goal is 0.6192
The third goal is 0.6370

PYTH/USDT A Bullish Trajectory in Sight?👀🚀PYTH Today Analysis💎 Paradisers, prepare for an attractive trading opportunity with #PYTHUSDT, as it's showing potential for a bullish continuation following a retest of its demand zone.
💎 Examining #PYTHNETWORK past performance, we've observed its consistent movement within a descending channel. Interestingly, it has also formed a cup and handle trajectory. Currently, it has broken above the handle, increasing the likelihood of a bullish move from the retest of the demand level at $0.35044. If the momentum is sustained, our target is set above the major supply zone at $0.55717.
💎 Nonetheless, in the ever-changing world of trading, having an alternate strategy is key. Should our initial analysis not come to fruition, we're ready to pivot to a potential bullish rebound from a lower support level at $0.30686. Keep in mind, however, that breaking below this level could lead to a considerable bearish descent.

$PYTHVWAP pinch up.
RSI trending above 50
Channel Up trend
Break to 0.97
Big Air drops coming. This mean alot of staking and no selling...pump is coming

PYTH - Taking some Profits Today (Buy other ALTS)0.66 target Hit and 0.89 is resistance so..time to take profits here, at least partially (selling 80% of my spot).
🌟 Bitcoin's Breakout Surge: Professor's Big Charts Revealed 🌟
📈 Live Analysis Incoming!
Prepare for an in-depth journey through Bitcoin's latest surge as we go live on TradingView. Get ready for a session packed with insights and the unveiling of the Professor's big chart. Join us: Live Stream: www.tradingview.com
🚀 The Breakout Chart Breakdown
Witness the bullish momentum as Bitcoin smashes past the $47,650 barrier. With my analysis, we're looking at a bull run targeting $59.9K,
69K
, and the ambitious $79K. 🎯 Stay bullish and watch as the charts unfold the story live!
💹 Historic Patterns: A Roadmap to $79K
Reflect on the last breakout at $31,100 and its staggering rise to $46,000. Our charts have been the compass leading us to these profitable winds. Don't miss out as we dissect the potential climb to $79K, live!
🔍 Last Year's Chart: The Trendline Triumph
Cast your minds back to January 2023, when Bitcoin was a humble $18,000. Fast forward, and we're witnessing a breakout reminiscent of December 2020's rally from $7,500 to $24,000. Could we be on the cusp of reaching new all-time highs? Let's explore together.
⏱️ Halving Cycles: This Time It's Different
Every cycle writes its own story, and this one's no exception. We're approaching the halving with a market more aware and ready to advance. Tune in as we analyze why we might see an all-time high sooner than the previous cycles.
🌐 Join the Live Stream for the Full Picture
There's much more to cover, from halving cycles to breakout patterns. Ensure you're part of the live session for a comprehensive analysis that could redefine your trading strategy.
Catch the full live session and secure your front-row seat to Bitcoin's exciting journey: Join the Live Stream: www.tradingview.com
One Love,
The FXPROFESSOR 💙

PYTH (P24.P1.E1). MY ENTRY POINTSHi Traders,
My thoughts on PYTH and levels of interest justified by a few assumptions.
All the best,
S.SAri

$PYTH bullish on BinanceSEED_DONKEYDAN_MARKET_CAP:PYTH @PythNetwork was hype at @binance spot listing.
Breaking uptrend channel and sitting above the trendline at 0.46 level. Buy now and more at 0.4
#DYOR

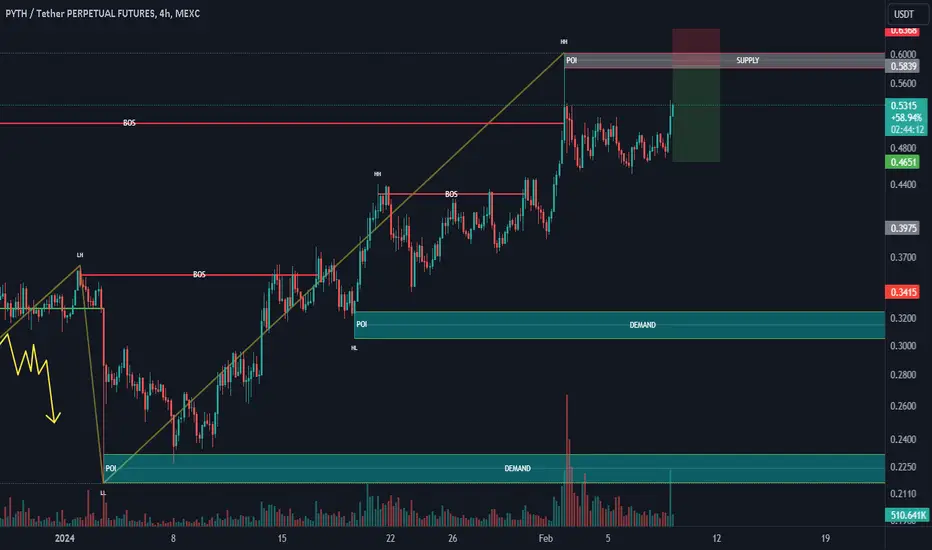
PYTHUSDT.PPYTHUSDT.P is in bearish trend.
Potentially printing LH and LL.
Bearish divergence also shown in RSI.
We wait and watch for the breakout of last LL.
PYTH; Road to $1Pyth smashed $0.54032 level and now going for New Ath..
●$1 for PYTH is not far....this coin has a bright future.
●For coming bull market we might see PYTH trading near $20 or even up.

PYTH inteligentassetApproaching an all-time high with limited historical data makes technical analysis more challenging.
bullish scenario
resistances 0.605 upper limit channel, 0.77 Fibonacci extension
bearish scenario
supports 0.496, 0.463, 0.451 pivot high,0.418

PYTH Another Path To Successful Trade
**Foundational:**
* **Oracle Integration:** PYTH successfully integrated with Chainlink, a leading decentralized oracle network, in January 2024. This allows for secure and reliable access to real-world data on the blockchain, which strengthens the foundation of PYTH's price feeds.
* **Exchange Listings:** PYTH is now listed on several major cryptocurrency exchanges, including Binance, Huobi, and OKEx. This wider accessibility is expected to increase adoption and demand for the PYTH token.
**Recent Developments:**
* **Community Growth:** The PYTH community has been steadily growing, with active participation in various forums and social media channels. This suggests strong interest in the project and its potential.
* **Partnerships:** PYTH has announced partnerships with several DeFi and NFT projects, aiming to integrate its price feeds into their applications. This collaboration could expand PYTH's reach and utility within the cryptocurrency ecosystem.
**Disclaimer:**
I am unable to provide financial advice or recommendations. Please do your own research before making any investment decisions.
**Additionally:**
* It is important to note that the cryptocurrency market is highly volatile and speculative. Past performance is not necessarily indicative of future results.
* You should carefully consider your own risk tolerance and financial situation before investing in any cryptocurrency, including PYTH.
I hope this information is helpful. Please let me know if you have any other questions.

PYTH - LongPYTH completed a type 2 return at a 0.886. Not the most formal harmonic but this has all that you look for when trading these patterns. Local level acting as support on the type two, clear exit points.
Good luck.

PYTH NETWORKI really like this chart and the project.
Looks like a giant flag in progress.
The project is an oracle with a lot of utility and official partnerships among the biggest in the crypto field.
(Yes i'm positioned)

PYTH SHORT hello Traders, here is the full analysis for this pair, let me know in the comment section below if you have any questions, the entry will be taken only if all rules of the strategies will be satisfied. I suggest you keep this pair on your watchlist and see if the rules of your strategy are satisfied. Please also refer to the Important Risk Notice linked below.
PYTH one of the best Solana play in next cycleLet's start with the basics.
Pyth is prica oracle by analogy with $LINK. One of the most fundamental projects in the ecosystem, whose infrastructure is used by many other Solana dApps
From a price perspective, PYTH has already formed a local bottom and we could be looking at adding to the position at this level
I look quite positively at this asset as a potential upside to Solana.
If the market and Solana are ok, I expect $1+ here.
The position is long term, not recommended for all scalping and lower TFs.

PYTH Surges 5% as It Tries to Re-Enter a Positive Price ChannelOKX:PYTHUSDT dropped below the lower boundary of a medium-term positive price channel in the last 24 hours. However, buyers quickly jumped in to minimize the damage, and are currently attempting to elevate it back within the bullish range. Should PYTH close a 4-hour candle in the range within the next 12 hours, it could soon attempt a challenge at the $0.5180 resistance level.
A break above this major threshold could then give the Pyth Network price the foundation needed to rise to the subsequent resistance level at $0.5985 through the course of the following few days.
This bullish thesis may be invalidated if PYTH closes 2 consecutive 4-hour candles below the bullish price channel within the next 24 hours. In this alternative scenario, the crypto could be at risk of dropping to the immediate support level at $0.4385 in the short term. Continued sell pressure at this point may then lead to the Pyth Network price dropping to as low as $0.3820.
Bulls Could Boost PYTH Above Resistance
Technical indicators on PYTH’s 4-hour chart are flagging bullish, which suggests the Pyth Network price may rise in the next 48 hours. The Moving Average Convergence Divergence (MACD) line is closing in on the MACD Signal line. These two lines crossing in the next 24 hours may signal that PYTH has entered into a bullish cycle.
In addition to this, the Relative Strength Index (RSI) line is positioned above its Simple Moving Average (SMA) line. Traders may see this as a sign that buyers are currently stronger than sellers. As a result, bulls may drive the Pyth Network price higher in the upcoming days.

PYTH price "is trending", but in which direction?)For a couple of days now, PYTH has been in various "ratings of interesting coins," so let's write a few words about what we see on the chart.
The fact that after +50% growth in early February, each daily candle closes with a shadow on top is not good for buyers. This means that someone is selling PYTHUSDT quite aggressively in the range of $0.48-0.52.
Now, a correction of at least $0.42-0.43 is very much needed.
And then it will be seen:
- whether the hype and pump will continue at least to $0.70
- or the correction will continue to the range of $0.30-0.33 for a safer purchase.
_____________________
Did you like our analysis? Leave a comment, like, and follow to get more

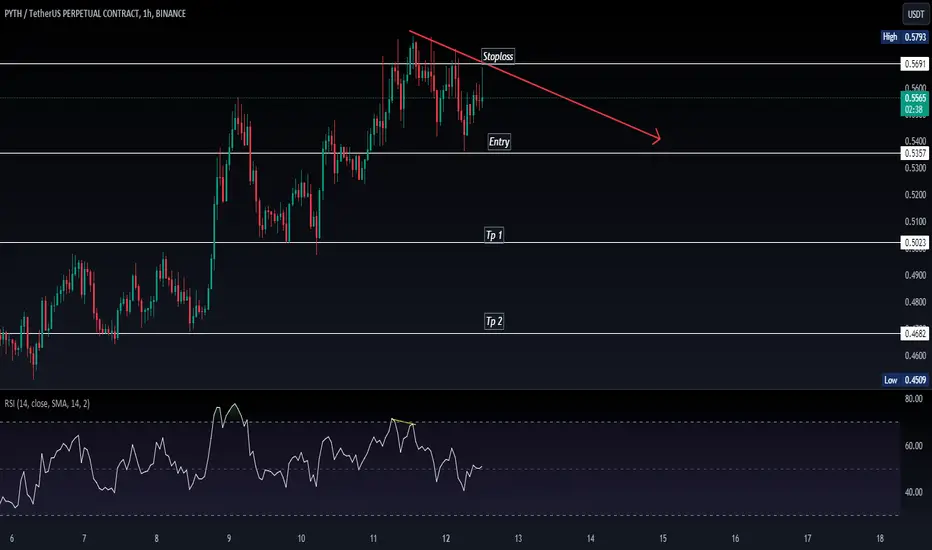
$PYTH Short Idea1. we have market structure shift.
2. we have price hitting a major high of 0.55 - institutional key level.
3. we have draw as the old low and fvg
4. we have a breakaway gap which i would like it to be left unfilled.

PYTH Trades in a Bullish Channel, How High Can It Go?OKX:PYTHUSDT continues to trade within a bullish price channel that it managed to recover to back within after surpassing the $0.4385 resistance level. Should this positive momentum continue, the crypto could attempt to flip the resistance level at $0.5180 into support as well. A daily candle close above this barrier could then give the altcoin the foundation needed to rise to $0.5985 in the following few days.
This bullish thesis could be invalidated if the Pyth Network price breaks below the lower boundary of the bullish price channel within the next 48 hours. In this alternative scenario, PYTH may retest the aforementioned $0.4385 mark. Continued sell pressure may drag the altcoin down to $0.3820. Losing the support of this level could then expose the Pyth Network price to the risk of falling to $0.3140 in the short term.
Technical indicators on PYTH’s daily chart suggest the Pyth Network price could continue climbing in the next 48 hours. Both the Moving Average Convergence Divergence (MACD) and the Relative Strength Index (RSI) indicators are flagging bullish.
The MACD line is breaking away above the MACD Signal line, which could be taken as a sign that PYTH’s bullish trend is growing stronger. This technical flag is supported by the RSI line, which is breaking away above the Simple Moving Average (SMA) line. Traders may see this as a signal that bulls are growing stronger against bears, and may boost the Pyth Network price in the upcoming days.
