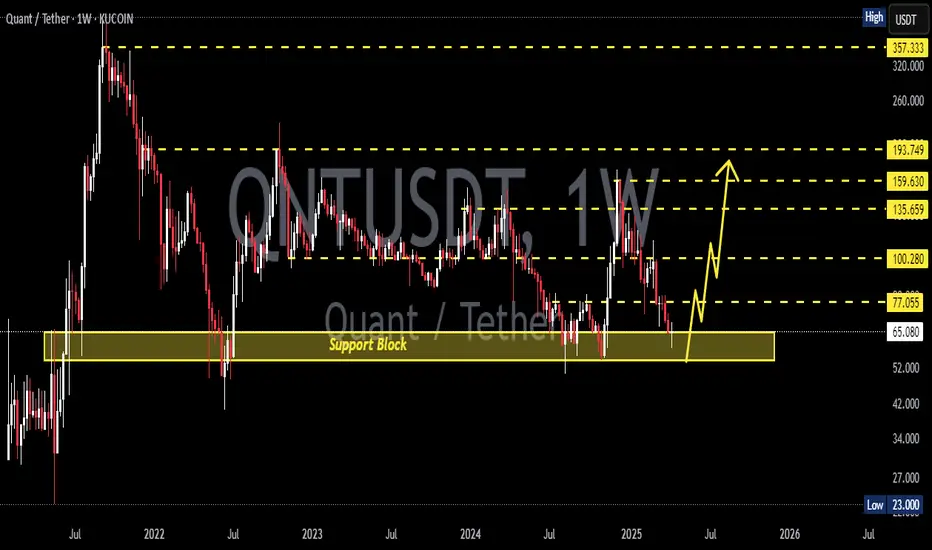
Quant's 2025 All-Time High Potential Revealed In This AnalysisQuant has been producing higher lows since June 2022, a solid base.
QNTUSDT is about to close its fourth week green and this week is a full green candle. A strong advance/bullish breakout and months of bearish action recovered to now trade within the bullish zone.
What is happening here is the sam

QNT - The Bulls are Leading!Hello TradingView Family / Fellow Traders. This is Richard, also known as theSignalyst.
📈After breaking above the last major high marked in red, QNT has been overall bullish trading within the rising wedge pattern marked in blue.
Moreover, the green zone is a strong demand and structure.
🏹 Thus

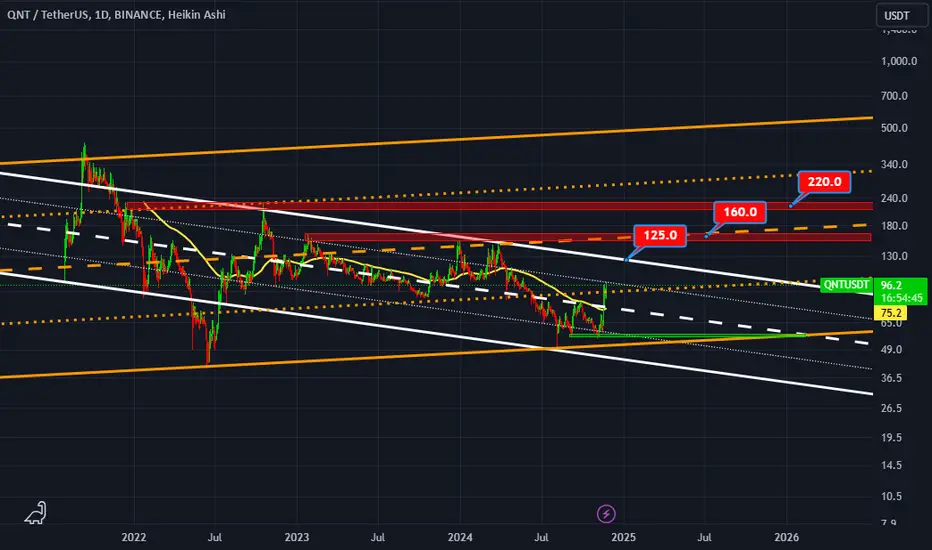
QNT is about to take off like a rocket soon (1D)The higher structure of QNT is bullish, but its internal structure has turned bearish.
Therefore, we can look for buy/long positions in fresh and unmitigated Demand zones.
Targets are marked on the chart.
A daily candle closing below the invalidation level will invalidate this analysis.
Do not e

TradeCityPro | QNT: Ranging Near Key Resistance in RWA Favorite👋 Welcome to TradeCity Pro!
In this analysis, I want to review the QNT coin for you. This project is one of the RWA projects that has been heavily hyped in recent months.
✔️ Currently, this coin has a market cap of $908 million and ranks 72 on CoinMarketCap.
⏳ 4-Hour Timeframe
On the 4-hour timefr

QNTUSDT 1D#QNT is on the verge of breaking out above the falling wedge pattern and the MA50 on the daily chart. In case of a breakout, the targets are:
🎯 $86.2
🎯 $103.2
🎯 $117.0
🎯 $130.8
⚠️ Use a tight stop-loss.

QNT - The best is yet to come!Looks like QNT has a long way ahead, though the major 125$ resistannce is crucial.
QNTUSDT 1WQNT ~ 1W Analysis
#QNT Buy gradually from here if you still have a Conviction on this coin with a short -term target of at least 15%+.
QNTUSDT Short Opportunity: Technical Pullback on the RadarMy analytical model based on EASY Trading AI strategy flags a potential bearish move for QNTUSDT. Current market conditions support a short position entry at 70.3. Why bearish? Price action displays weakening bullish momentum, indicating sellers might retake control. Clear bearish indicators show a

A DIVERGENCE PLAY ON QNT [KaT.3]QNT/USDT - 1H & 4H Timeframe Analysis
-The chart indicates a bullish divergence, suggesting potential upside momentum.
-Price is currently in a downtrend, forming a higher low divergence compared to the oscillator (not visible but implied).
-Liquidity Grab: waiting for the recent lows to be cleare

QNT analysis (12H)The price appears to have completed an ABC pattern and is now in wave D or X. The red zone is where sell/short positions can be considered.
Targets are marked on the chart.
A daily candle closing above the invalidation level will invalidate this analysis.
For risk management, please don't forget

See all ideas
Summarizing what the indicators are suggesting.
Oscillators
Neutral
SellBuy
Strong sellStrong buy
Strong sellSellNeutralBuyStrong buy
Oscillators
Neutral
SellBuy
Strong sellStrong buy
Strong sellSellNeutralBuyStrong buy
Summary
Neutral
SellBuy
Strong sellStrong buy
Strong sellSellNeutralBuyStrong buy
Summary
Neutral
SellBuy
Strong sellStrong buy
Strong sellSellNeutralBuyStrong buy
Summary
Neutral
SellBuy
Strong sellStrong buy
Strong sellSellNeutralBuyStrong buy
Moving Averages
Neutral
SellBuy
Strong sellStrong buy
Strong sellSellNeutralBuyStrong buy
Moving Averages
Neutral
SellBuy
Strong sellStrong buy
Strong sellSellNeutralBuyStrong buy
Displays a symbol's price movements over previous years to identify recurring trends.
Curated watchlists where QNTUSDT.P is featured.

Interoperability Crypto: Communication station
14 No. of Symbols
See all sparks