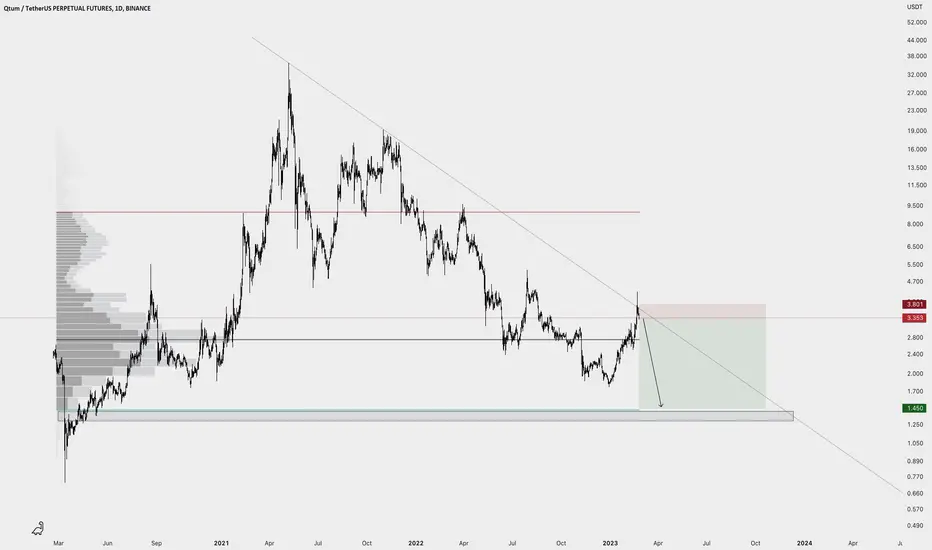
QTUM LOOKS BULLISHHi, dear traders. how are you ? Today we have a viewpoint to BUY/LONG the QTUM symbol.
For risk management, please don't forget stop loss and capital management
When we reach the first target, save some profit and then change the stop to entry
Comment if you have any questions
Thank You
QTUMUSDT.P trade ideas

QTUMUSDT.1DHello Crypto Lovers, This is a 1D frame analysis for QTUMUSDT As you can see, the price is below a resistance line which has been attempted to be broken multiple times but has not been able to do so. Currently, we have two scenarios in mind. Scenario one: If the price is unable to establish itself above the resistance line, we expect it to take a brief rest and then move downwards towards its support line. Scenario two: But we expect the price to be able to move above the resistance line and eventually move towards its Warning: This is just a suggestion and we do not guarantee profits. We advise you to analyze the chart before opening any positions. Take care


QTUMUSD: Bullish Deep Gartley PCZ Near 200 Day SMA and 0.618QTUM is sitting at PCZ of a Bullish Deep Gartley it's formed locally near the 200 Day Moving Average and the overall range low to high log scale 0.618 where it may try to rally from to later attempt a break of the trendline and then going for new highs.

QTUM Talk to me like lovers doQtum retested 2.66 support, Pretty Bullish, read to test some resistance levels.
Stop 2.50
Leverage 10x-20x

Qtum Looks Ready for Solid recovery Seems Like Getting ready for recovery Approaching towards Trendline Incase Of breakout expecting Move towards 10$ in midterm


QTUM Short TradeFeeling bearish today... also taking a QTUM leveraged short trade.
Even if the movement is corrective, I believe we´ll still have at least another leg down.

Bullish Divergence on MACD - QTUMUSDT May See 9% Price IncreaseQTUMUSDT has recently shown a promising bullish divergence on the MACD, and after testing the bottom of the descending channel, it has broken above the downtrend trendline. This is a strong indication of short-term bullish momentum, and we could see a potential 9% price increase from the most recent support.
However, we must remain cautious as the recent low still poses a threat. If it gets taken out, bears will gain control and we may see a downtrend continuation.

Traders Keep Watch on #QNTUSDT Demand Zone#QNTUSDT has approached the critical demand zone, which traders have been watching for a year now. Currently #QTUM is also testing 161.8% Fibonacci support, where today we are seeing a clean bounce.
For the bulls, it should be quite an important level to watch, especially a daily close around it. Because if it holds, followed by a $3.5 resistance breakout, trend can turn aggressively bullish. On the other hand, a daily break and close below the demand zone should be the sign that bears are in control.

QTUM formed bullish Gartley for upto 53.50% pumpHi dear friends, hope you are well and welcome to the new trade setup of QTUM coin with US Dollar pair.
Previously we caught 55% pump of QTUM as below:
Now on a daily time frame, QTUM has almost formed another bullish Gartley for the next price reversal.
Note: Above idea is for educational purpose only. It is advised to diversify and strictly follow the stop loss, and don't get stuck with trade

QTUMUSDT Price PredictionAs can be seen on weekly timeframe QTUM/USDT has failed to hold the lows below the shown support and has also retested and rejected it to the upside.
With this much bullish structure a test of high at 4.33 is ver likely.

QTUMUSD (4H) - Bearish reversalHi Traders
QTUMUSD (4H Timeframe)
Waiting for the downward break of the 2.935 support level which will complete a bearish trend reversal pattern to go SHORT. Only the upward break of 3.422 would cancel the bearish scenario.
Trade details
Entry: 2.935
Stop loss: 3.422
Take profit 1: 2.634
Take profit 2: 2.148
Score: 6
Strategy: Bearish reversal

The key is whether it can rise above 3.283 around March 29thHello?
Traders, welcome.
If you "Follow", you can always get new information quickly.
Please also click "Boost".
Have a good day.
-------------------------------------
(QTUMBTC 1W chart)
The key is whether it can rise above 0.0001 825 to 0.0002 373.
-------------------------------------------
(QTUMUSDT chart)
In order to continue the upward trend from a long-term perspective, it must rise above 5.529.
To do so, we need to see if we can sustain the price by moving above 3.283.
That way there is a chance of getting out of the bottom section.
if it goes down,
1st: 2.823
2nd: 2.222
You need to check if it is supported in the vicinity of the 1st and 2nd order.
-------------------------------------------------- -------------------------------------------
** All descriptions are for reference only and do not guarantee profit or loss in investment.
** Even if you know other people's know-how, it takes a considerable period of time to make it your own.
** This is a chart created with my know-how.
---------------------------------


qtumusdt longidea for long scenario with short SL. seems like the coin found a resistance to continue its long position. TP and SL you can see on the chart.
dont forget to fix your position and move SL closer to TP.


#QTUMUSDT 4H Chart
Price is consolidating between the 0.618 Fibonacci level at $3.2 and the resistance area around $3.5. MACD is not clear, RSI is sold and EMAs are neutral. I expect price to trade deeper into the 12h demand at $3 before potentially moving up again from there.

QTUM hasnt even started huh?
Still bound within channel but clocks ticking and 0.236 already triggered.
Which confluence is so obvious? Right, see you there bisches
---
If you like my content, if it helps you gain profits, give it a like!
Thanks!
---
Hold my beer pls
----
No financial advice, do your own research, don't be stupid

Qtumusdtfinally Long consolidation Is Over descending channel Breakout Confirmed
Expecting Move Toward 7 to 8
safe sl would be Black Line On chart

QTUM: INCREASE VIEWQTUM Showing depends on a low time frame increase view.
we will follow this coin to check the trend out.
🌠We will monitor QTUM to see if it shows any upward movement in the lower time frames. If the trend looks promising, we will continue to track it beyond the initial 24-hour period

QtumUsdt little patient for movenow laging and need little more rest and rdy for moveup
wait for EntryPoint
dont rush 1 resistance trend line onway but can break that only eed little you wait for start move
and market should can save own( btc)
GL
EntryPoint:
2.810
2.590
Supports:
2.425
2.270
2.065
1.835
Resistances:
2.873 (now break thsi but cna back)
3.135
3.363
Targets:
3.608
3.990
4.532
5.330
5.800
6.550
8.230
9.686
Midtime:
11.908
14.960
17.588
21.606
HODL:
27.185
31.260
39.260
GL
