TradeCityPro | RENDER: AI Token at Breakout or Breakdown Point👋 Welcome to TradeCity Pro!
In this analysis, I want to review the RENDER coin for you. This project is one of the crypto AI projects that gained a lot of hype after AI projects started trending.
🔍 The coin of this project currently has a market cap of $2.36 billion and ranks 45th on CoinMarketCap.

RENDERUSDT 1D AnalysisRENDER ~ 1D Analysis
#RENDER Buy after successfully penetrating this resistant line with a short -term target of at least 10%+ from here.
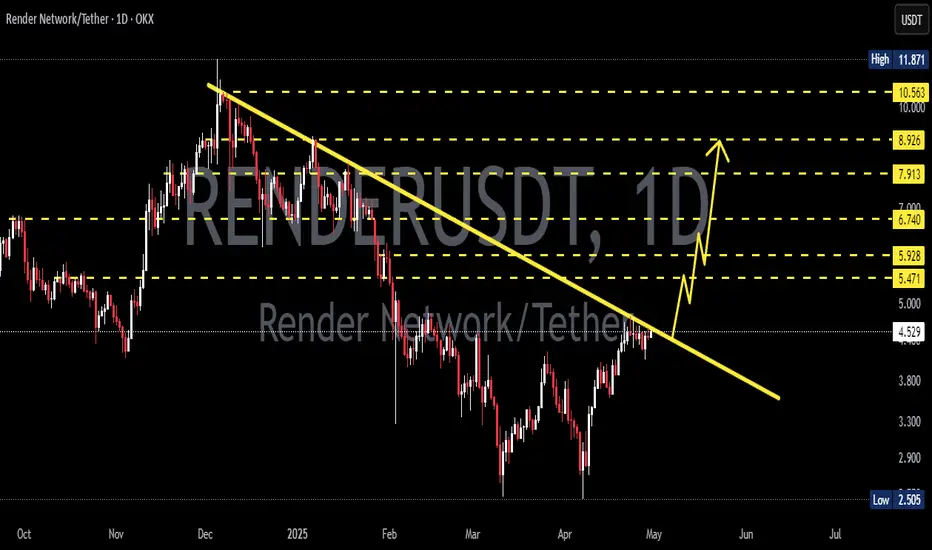
RENDER Breakout AlertSuccessfully breakout this resistant line with a short -term target of at least 10%+.

Render on Top !this mega altseason could be AI season so AI tockens which is located to US are more profitable
dont forget its not financial advice its my analysis about this chart

RENDER/USDT:BUY Hello friends
Given the price growth we had, a range has now been created in the price correction, which indicates the strength of the trend, so we can enter the trade.
The purchase and target points have also been identified...
Follow capital management.
*Trade safely with us*

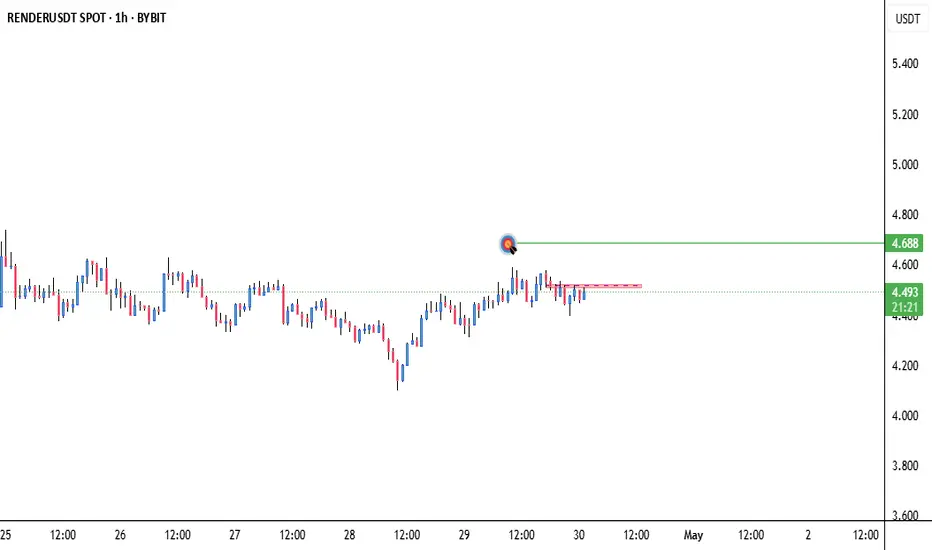
Render is dumping Well, as you can see, the render has hit its daily resistance and broken the 4-hour uptrend from below and can go down to the daily support area. The first target is around 2.7 and the second target is the support area of $1.
This is not an investment offer or a buy or sell signal. This is simply my

RENDER Testing Red Resistance Zone🚨 RENDER Testing Red Resistance Zone 🚨
RENDER is currently testing a significant red resistance zone. A breakout above this level could signal a bullish move, with the target set at the green line level.
📈 Technical Overview:
Resistance Zone: Red area currently being tested.
🎯 Breakout Target: Gr
RENDER/USDT Technical Analysis:
FIB Level to watch: Measured from swing high $6.116 to low $2.476, we have the following retracement zones:
Level
Price
0.236
$3.335
0.382
$3.866
0.5
$4.296
0.618
$4.726
0.786
$5.138
RSI (14): Bullish but Not Overheated
Current RSI: 47
RSI(Daily) - 61
Recent High: 66.11
Inte

Render Is Ready, Bottom Confirmed (340% Easy Target)Render Token is super ready right now and the correction bottom is now confirmed. Notice this pattern on the chart. There are two lows and then a move back above support.
The current candle is the bullish signal. After trading lower, it is now at the upper end of the session, trading near the sessi

Render getting ready for a reversal? RNDR price action got strong support twice at a good inflection point. Momentum and trend oscillators are diverging and in the bullish control zone. Market structure may confirm a choch.
Full TA: Link in the BIO

See all ideas
Summarizing what the indicators are suggesting.
Oscillators
Neutral
SellBuy
Strong sellStrong buy
Strong sellSellNeutralBuyStrong buy
Oscillators
Neutral
SellBuy
Strong sellStrong buy
Strong sellSellNeutralBuyStrong buy
Summary
Neutral
SellBuy
Strong sellStrong buy
Strong sellSellNeutralBuyStrong buy
Summary
Neutral
SellBuy
Strong sellStrong buy
Strong sellSellNeutralBuyStrong buy
Summary
Neutral
SellBuy
Strong sellStrong buy
Strong sellSellNeutralBuyStrong buy
Moving Averages
Neutral
SellBuy
Strong sellStrong buy
Strong sellSellNeutralBuyStrong buy
Moving Averages
Neutral
SellBuy
Strong sellStrong buy
Strong sellSellNeutralBuyStrong buy
Displays a symbol's price movements over previous years to identify recurring trends.