RLCUSDT 1D Analysis RLC ~ 1D Analysis
#RLC Buy on retesting this support block or buy after successfully breaking this resistance line with a short term target of at least 10%+.

RLCUSDT Pump Anticipated**📊 Entry:** Check the chart for optimal entry points.
**🎯 Targets:** 1.86 - 2.06 - 2.32 (51% potential move in spot).
**🛑 Stop-loss:** 1.280 – Stick to this level to manage risk.
💡 Remember to manage your position size carefully, keep an eye on market conditions, and don’t chase the trade if

RLC Risky Long Idea (Snipe)Here will try to go with a Snipe Entry on RLCusdt Pair if it gives me that price.
I believe if the entry area holds we are going to see a quick pump towards next levels.
Highly Risky Trade.
Strategy
Have leveraged entries set at 1.3750 and under.
with stops flat at 1.3580.
Note: Not a Financ

RLC up?As we got our favorite FBuy print and volume up and a news from RLC, let's see where this pump end up. stop loss below 1.3 DYOR
for indicator access you can drop a message.

#RLC/USDT#RLC
The price is moving in a descending channel on the 1-hour frame and is adhering to it well and is heading to break it upwards strongly and retest it
We have a bounce from the lower limit of the descending channel, this support is at a price of 1.13
We have a downtrend on the RSI indicator th

iExec RLC (RLC/USDT) - Key Levels To Watch 1HRLC is showing strong bullish momentum, currently trading around $1.34, with a potential breakout on the horizon.
A breakout above resistance with strong volume could lead to an explosive move!
Keep an eye on price action and confirmation signals.

RLC big picture planThe rising trendline over the last 5 years is the only thing that makes me still want to hold this coin. Therefore, in my opinion there is nothing that makes me believe we will go lower than current levels. As far as upside, I do believe sky is the limit. Let's observe how this evolves over the next

RLC SHORT !!!!#RLC/USDT
Entry zone : 1.3650 - 1.3306
Targets : 1.3186 - 1.2919 - 1.2653 - 1.2386 - 1.2120 - 1.1854 - 1.1587 - 1.1321
Stoploss :1.41

$RLC Looking for SHORT In the weekly timeframe, it seems that the price has broken its upward trendline.
But I'll wait for the pullback.
On the other hand, the price might also reach the upper drawn trendline, which could be a good point for a sell.

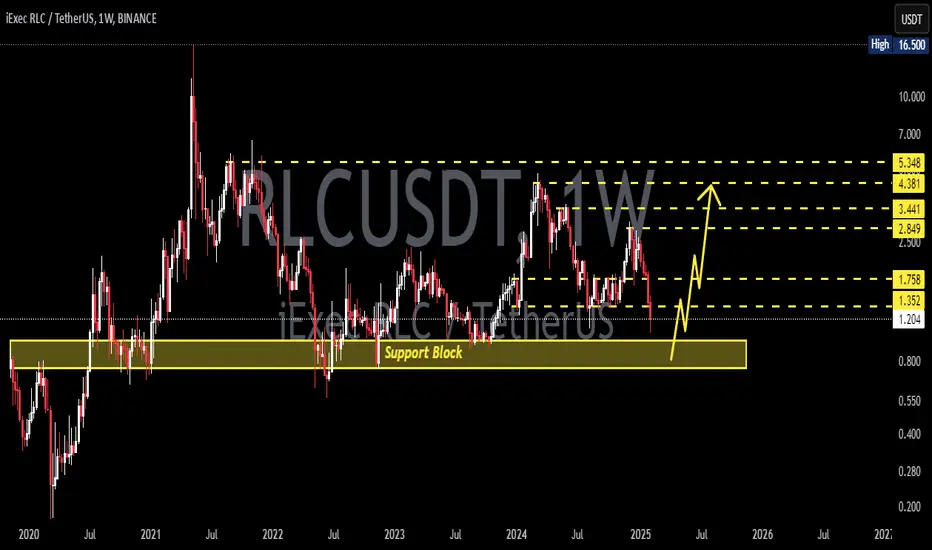
RLCUSDT 1WRLC ~ 1W Analysis
#RLC This support block continues to be maintained so far. Buy from here with a minimum target of 20%+.
See all ideas
Summarizing what the indicators are suggesting.
Oscillators
Neutral
SellBuy
Strong sellStrong buy
Strong sellSellNeutralBuyStrong buy
Oscillators
Neutral
SellBuy
Strong sellStrong buy
Strong sellSellNeutralBuyStrong buy
Summary
Neutral
SellBuy
Strong sellStrong buy
Strong sellSellNeutralBuyStrong buy
Summary
Neutral
SellBuy
Strong sellStrong buy
Strong sellSellNeutralBuyStrong buy
Summary
Neutral
SellBuy
Strong sellStrong buy
Strong sellSellNeutralBuyStrong buy
Moving Averages
Neutral
SellBuy
Strong sellStrong buy
Strong sellSellNeutralBuyStrong buy
Moving Averages
Neutral
SellBuy
Strong sellStrong buy
Strong sellSellNeutralBuyStrong buy
Displays a symbol's price movements over previous years to identify recurring trends.