ROSE nice AI play this yearROSE top tier AI token. Recently partnered with personal.ai. MACRO PICTURE
ROSEUSDT.P trade ideas

Oasis Network (ROSE) completing a BAT for upto 38% rallyHi dear friends, hope you are well and welcome to the new trade setup of Oasis Network (ROSE) with US Dollar pair.
Previously we caught more than 54% pump of ROSE as below:
Now on a daily time frame, ROSE is about to complete a bullish BAT move for another bullish reversal move.
Note: Above idea is for educational purpose only. It is advised to diversify and strictly follow the stop loss, and don't get stuck with trade

ROSEUSDT wants the breakout? The current price of ROSEUSDT is inside a descending channel after breaking out from the daily resistance level.
A descending channel is a technical analysis pattern that is formed when the price moves between two downward sloping trendlines. The upper trendline connects the highs, while the lower trendline connects the lows. In a descending channel, the price tends to move lower, bouncing off the upper trendline and finding support at the lower trendline.
In the case of ROSEUSDT, the price is currently trading within this pattern, indicating a bearish trend. This means that sellers are in control and are pushing the price lower. However, the fact that the price broke out of the daily resistance level suggests that there may be some bullish momentum building.
For traders looking to enter a long position in ROSEUSDT, they would need to wait for a breakout from the descending channel and ensure that the breakout satisfies Plancton's rules. Plancton's rules are a set of technical analysis guidelines that aim to identify high-probability trading opportunities. These rules include looking for strong trends, clear price patterns, and confirmation
–––––
Follow the Shrimp 🦐
Keep in mind.
🟣 Purple structure -> Monthly structure.
🔴 Red structure -> Weekly structure.
🔵 Blue structure -> Daily structure.
🟡 Yellow structure -> 4h structure.
⚫️ Black structure -> <= 1h structure.
Follow the Shrimp 🦐

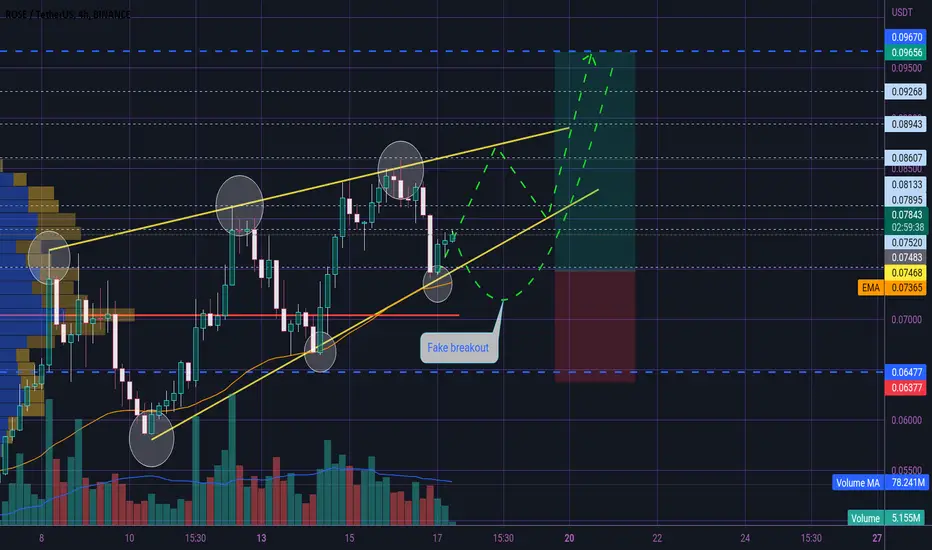
ROSE 🌹 ASCENDING WEDGE 😊☄😊☄😊Hi dear traders
Price moving in Ascending Wedge.
Now in support area we can open long position and take some profit 📈.
It's possible to fake breakout it.
As you can see ,set stop-loss below this area.
All targets specified.
Let's see what happens
This is not financial advice ( DYOR )
Good luck
ROSEUSDT long review entering at 0.073 at the previous HTF top now that price has accepted above this level seemed like a good place to build a long position.
The exit could have been improved, the bearish OB at 0.083 would have been better and price did reach it before turning short term bearish.

ROSEUSDTHello Crypto Lovers,
Mars Signals team wishes you high profits.
This is a 4-hour-time frame analysis for ROSEUSDT
R1 in this chart are our resistance area and includes the disability of the price to rise. And we have S1 that used to be a resistance area in the past. Hence, we see the price was rejected at several points at the white line (a resistance line) and then by having a neutral fluctuation between R1 and S1, it is now moving below R1. We believe it will have its falling trend due to the existence of a red candle here and via providing us some confirmation candles to fall, a decline would happen for the price toward lower amounts. Or possibly by giving us some rising signs, there would be an increase to higher amounts in case the price gives us some rising signs and a rise happens surely. The point is that if you are looking for wise trades and less risky ones, our suggestion will be following our regular updates.
Warning: This is just a suggestion and we do not guarantee profits. We advise you to analyze the chart before opening any positions.
Wish you luck

$ROSE Oasis Network Swing Trade Idea$ROSE Oasis Network Swing Trade Idea. Marketed levels for swing positions.

Rose trend break.There is a pretty tasty short on rose. Watch the micro structure shown for price agreement.

Rose / Usdt Price Prediction Rising Wedge Pattern In 4 Hour Time Frame May Be Rose Break Down Side And If Rose break Daily Sport Level ( Which is what you see in the picture ) Then Rose Go Down Good For Short.
But If Rose Break 0.618 Fib Level Andy Retest And if Price Price Hold 0.618 Levl Then Good For Long

Rose / Usdt Price prediction Rising Wedge Pattern In 4 Hour Time Frame May Be Rose Break Down Side And If Rose break Daily Sport Level ( Which is what you see in the picture ) Then Rose Go Down Good For Short.
But If Rose Break 0.618 Fib Level Andy Retest And if Price Price Hold 0.618 Levl Then Good For Long

ROSEUSDTA clear bullish peanut pattern for rose is coming. After confirmation, it worth opening a long position

ROSEUSDT wants to go higher?ROSEUSDT has made more than 35% since your previous idea, and the market has experienced a breakout from the descending channel.
The descending channel is a bearish technical pattern in which the price action of an asset moves downward within two downward sloping trend lines.
A breakout is a significant price movement that occurs when the price exceeds the boundaries of a previously established pattern or trend.
Now, the price of ROSEUSDT has experienced another breakout from another descending channel, indicating a potential change in trend from bearish to bullish. As a trader, you are waiting for Plancton's rules to be met in order to enter a new long position and potentially profit from the stock's upward momentum.
By waiting for the conditions outlined in Plancton's rules to be met, you can make informed trading decisions and potentially increase your chances of success.
–––––
Follow the Shrimp 🦐
Keep in mind.
🟣 Purple structure -> Monthly structure.
🔴 Red structure -> Weekly structure.
🔵 Blue structure -> Daily structure.
🟡 Yellow structure -> 4h structure.
⚫️ Black structure -> <= 1h structure.
Follow the Shrimp 🦐

ROSEUSDT - A garden of roses - on FIRERoses are red
Violets are blue
You should be taking profit
I have but have you?
There were so many different buying opportunities outlined on the chart here going back into late December and early January but it has run and we're starting to create a very large ending diagonal. It's best to take profit on any position that may be open on ROSEUSDT. I do not suggest opening any kind of a short position until trendlines are broken to the downside.
There is some overbought signals on many higher timeframes.

Rose failed to base out of wedgeThis looks like a reasonable setup for me. I thought it would probably base up but I think this will descend into the channel visible on 4hr.
This is good for a scalp.
Asset has not been moving like much of the rest of the market so I'd keep an eye on it as it may be due.
We must be close to the peak of the rally now.


TheNewsCrypto ROSE "Ascending Scallop"An ascending scallop pattern is a bullish continuation pattern that appears near the top of an uptrend. It's characterized by a rising price trend, followed by a short-term retracement, and then another rise to form a higher peak. This creates a scallop shape on a stock chart.
Currently the price of Rose is trading in the range of 0.08373, If pattern continues it might reach to the next resistance level $ 0.09670 , If trend breaks below support level it may fall till $ 0.07522

$roseclose above the 200 ema on the hourly
could long with a stop below
this still imo is all a deviation once we reclaim white line we start flipping sentiment

roseThe midline of the channel is supported and we have to see if it reacts to its resistance at the ceiling of the channel or not?
In case of correction, we have the green lines and the bottom of the channel, and in case of passing through the roof of the channel, we have the two red numbers

✴️ Oasis Network | New High Hit (Name Your Altcoin #39)Another altcoin that is looking great is Oasis Network (ROSEUSDT), thanks for calling this to my attention.
It grew by 50% last week, hit a multi-months high and also shows the highest volume since August 2022 and overall one of the highest volume weeks ever.
The most important signal on this chart is the major downtrend coming off the January 2022 high being broken.
The stop-loss hunt event/fish shakeout is marked yellow as a "cup pattern".
This is not a "new low" technically, this is a "guided" move.
If we didn't have any manipulation by big players prices would remain consolidating above the June 2022 low.
It only breaks below this level because the big players can see where all the stops are, they get activated and as soon as this happens the next wave can start.
Notice that as soon as the stop-losses are activated strong bullish action ensues.
That's why we avoid placing stop-loss. We only write them down manually or else you can get kicked out of your position just to have to buy back again at a higher price.
Anyway, with a major downtrend now broken, a new trend can start to take form.
The potential targets mapped on the chart are based on the medium-term, long-term there can be more.
Namaste.

ROSEUSDT | NEW UPDATE...ROSE has already gain 48% from our last analysis.
Now as price is moving in a broadening channel So currently price is trading near the upper boundary of channel. There are multiple resistance zone for further bullish trend continuation.
1) Upper boundary channel
2) 0.618 fib level
3) Horizontal Resistance
The price has also printed bearish divergence and formed bearish gravestone doji near resistance.
Manage your levels accordingly

Rose turning redHello my friend
The support and resistance levels ahead have been identified, I expect that after returning from the first resistance, it will gradually rise to the next resistance area. be happy

RoseUsdt can explodenow Rose is redy for explode
Rose on top100 Coin and can save on bear market
now AI is trend. rose AI and Web3.0 Project
so for save is good
and this chart rdy for explode after little correction
GL
EntryPoint:
0.06388
0.05700
Supports:
0.05200
0.04743
0.04160
0.03520
Resistances:
0.07120
0.08035
Targets:
0.08875
0.09790
0.11260
0.13450
MidTime:
0.16895
0.19028
0.22540
0.31030
0.38900
0.51900
HODL:
0.71445
0.89550
1.19650
GL
you can see H&SH
and target for that.

