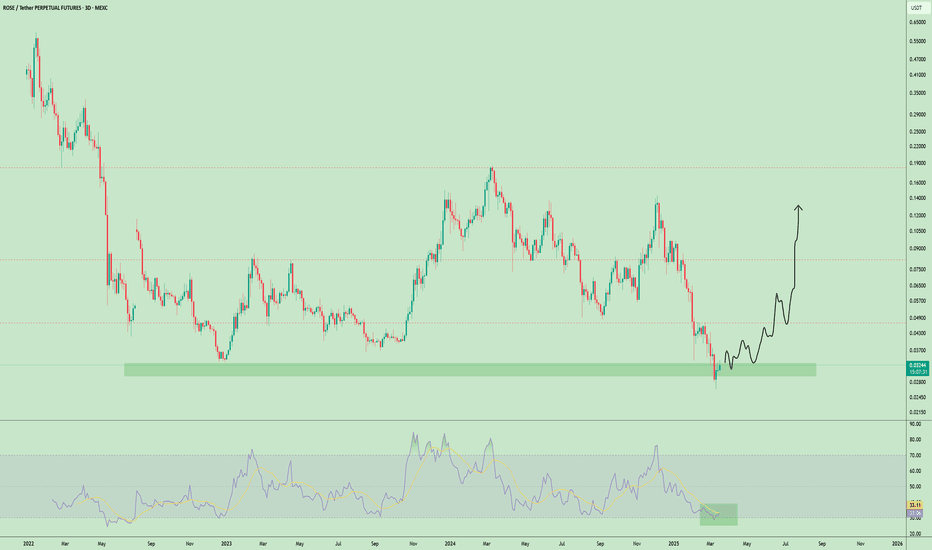
ROSEUSDT Key Inflection Zone Amidst WXY Corrective StructureROSEUSDT is currently exhibiting a broad bearish corrective structure, taking the form of a potential WXY complex correction. Price action has been coiling within a structurally significant range, with the immediate demand zone acting as the current base of accumulation. This area presents a favorab
ROSEUSDT | Long | Technical Bounce + Strong Backing | (May 2025)ROSEUSDT | Long | Technical Bounce + Strong Backing | (May 2025)
1️⃣ Quick Insight:
ROSE has been in a downtrend for a while, but it's now showing some promising signs both technically and fundamentally. Price action is shaping up well, and I’ve decided to enter spot at the current level.
2️⃣ Trad
#ROSE/USDT#ROSE
The price is moving within a descending channel on the 1-hour frame and is expected to break and continue upward.
We have a trend to stabilize above the 100 moving average once again.
We have a downtrend on the RSI indicator that supports the upward move with a breakout.
We have a support
Reversal Alert: $ROSE Clears Trendline, Next Stop $0.060?$ROSE/USDT is showing early signs of a potential trend reversal. After months of respecting a strong descending trendline, price has finally broken above it and is now consolidating just below a key resistance zone.
This area aligns with both the previous supply and the 50 EMA, making it a critical
ROSE — Quiet Strength Before the BloomClean entry on ROSE at 0.02436, with another limit order ready on margin at 0.02367. The price action has been subtle, but the setup hints at accumulation. If bulls hold the range — upside could come quick.
Watching for a grind-up toward:
0.02462 → 0.02498 → 0.02559 → 0.02621 → 0.02682
Stop set at
#ROSE Bouncing from Key Demand Zone!#ROSE Bouncing from Key Demand Zone!
ROSE just tested a strong support area and is showing signs of reversal. RSI is recovering from oversold levels—momentum could be shifting!
🔹 Current Price: $0.031
🔹 First Target: $0.05
Could this be the start of a major uptrend?
Retweet if you're bullish!
#C
You won’t believe how bearish ROSE is! (1W)A lot of data is now available on the rising pattern of ROSE. It appears that a large triangle has been completed, which was our wave B.
With the break of the B-D trendline, the triangle is now finished, and we are currently in wave C. Wave C is bearish and should take more time than the large wave
Wave 3: The Moment of TruthWave 3 has awakened.
This is not just another move, not a fleeting rally. It is the raw force of the market in its purest form. Everything Wave 2 tried to suppress—fear, doubt, hesitation—is now a thing of the past. The correction served its purpose: to separate the weak from the strong, to prepare
See all ideas
Summarizing what the indicators are suggesting.
Oscillators
Neutral
SellBuy
Strong sellStrong buy
Strong sellSellNeutralBuyStrong buy
Oscillators
Neutral
SellBuy
Strong sellStrong buy
Strong sellSellNeutralBuyStrong buy
Summary
Neutral
SellBuy
Strong sellStrong buy
Strong sellSellNeutralBuyStrong buy
Summary
Neutral
SellBuy
Strong sellStrong buy
Strong sellSellNeutralBuyStrong buy
Summary
Neutral
SellBuy
Strong sellStrong buy
Strong sellSellNeutralBuyStrong buy
Moving Averages
Neutral
SellBuy
Strong sellStrong buy
Strong sellSellNeutralBuyStrong buy
Moving Averages
Neutral
SellBuy
Strong sellStrong buy
Strong sellSellNeutralBuyStrong buy
Displays a symbol's price movements over previous years to identify recurring trends.
Curated watchlists where ROSEUSDT.PS is featured.

Smart contracts: Make the smart decision
36 No. of Symbols

Up-and-coming crypto: New kids on the block
30 No. of Symbols
See all sparks


