SAGA Rebuy Setup (8H)A strong move has formed, and we have a bullish CH (Change of Character) on the chart.
We can look for buy/long positions around key zones, as buyers are present in these areas.
We are focusing on buy/long positions at the entry points.
Targets are marked on the chart.
A daily candle close below

SAGAUSDT 2D AnalysisSAGA ~ 2D Analysis
#SAGA Buy after successfully penetrating this resistant line with a short -term target of at least 15%+ from here.

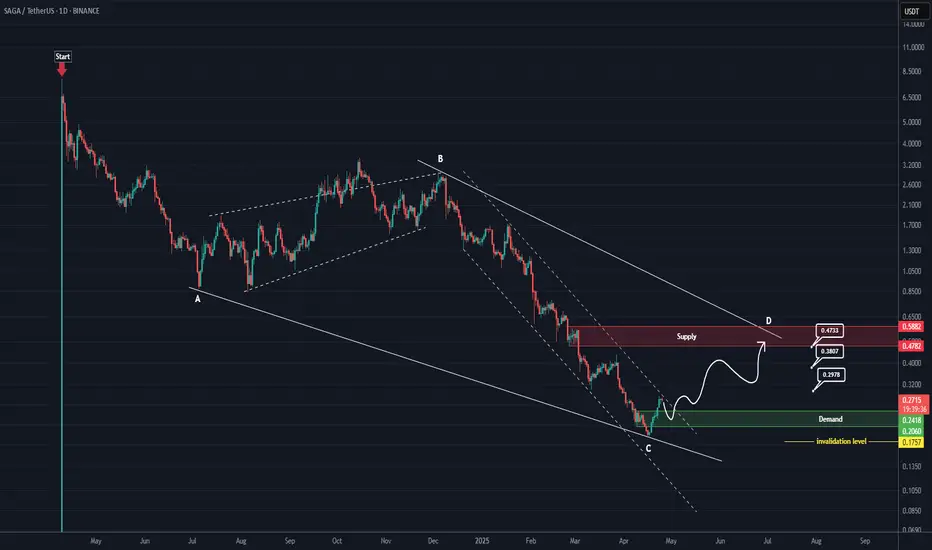
SAGA RoadMap (1D)From the point where we placed the red arrow on the chart, it appears that SAGA's correction has begun.
This correction seems to be either a diametric or a symmetrical pattern. Now, considering the extended duration of wave C, its relative comparison with the other waves, the heavy drop, and the fo
$SAGA Long Trade #freesignal
LSE:SAGA Long
Leverage : 3-5x
Entry 1 : 1.415
Entry 2 : 1.32
TP: 1.6177
SL : 1.2288
I want you to use SL and do proper risk management thanks.
like and share with love

SAGAUSDTmy entry on this trade idea is taken from a point of interest above an inducement (X).. I extended my stoploss area to cover for the whole swing as price can target the liquidity there before going as I anticipate.. just a trade idea, not financial advise
Entry; $0.2819
Take Profit; $0.2612
Stop

SAGA buy/long setup (4H)The SAGA symbol has made significant breakouts and formed a support zone. Additionally, there is a bullish iCH on the chart.
We can look for buy/long opportunities on this symbol.
Targets are marked on the chart.
A daily candle closing below the invalidation level will invalidate this analysis.

SAGAUSDTmy entry on this trade idea is taken from a point of interest below an inducement (X).. I extended my stoploss area to cover for the whole swing as price can target the liquidity there before going as I anticipate.. just a trade idea, not financial advise
Entry; $1.0158
Take Profit; $1.1015
Stop

SAGA Long OpportunityThis is the type of trade which I take without thinking twice.
Bottom with bullish RSI divergence
Higher high without divergence
Impulsive pattern to the upside, corrective pattern to the downside
Low risk, high reward
You can enter half or 1/3 position here and wait and see, if the SL is hit, mak


3.45 RRSaga held Polarity, and is laddering long-term. The recent higher high suggests once a local bottom is found--coupled with the lack of strong resistance on the top--a new local high can be achieved. Target 1 should be a fairly safe exit in light of this possibility.

See all ideas
Summarizing what the indicators are suggesting.
Oscillators
Neutral
SellBuy
Strong sellStrong buy
Strong sellSellNeutralBuyStrong buy
Oscillators
Neutral
SellBuy
Strong sellStrong buy
Strong sellSellNeutralBuyStrong buy
Summary
Neutral
SellBuy
Strong sellStrong buy
Strong sellSellNeutralBuyStrong buy
Summary
Neutral
SellBuy
Strong sellStrong buy
Strong sellSellNeutralBuyStrong buy
Summary
Neutral
SellBuy
Strong sellStrong buy
Strong sellSellNeutralBuyStrong buy
Moving Averages
Neutral
SellBuy
Strong sellStrong buy
Strong sellSellNeutralBuyStrong buy
Moving Averages
Neutral
SellBuy
Strong sellStrong buy
Strong sellSellNeutralBuyStrong buy
Displays a symbol's price movements over previous years to identify recurring trends.