Long-term #SANDUSD #SANDUSDT Analysis - MONTLYWith the recent events on cryptocurrency; I think we will start seeing less coins getting pumped and more of the solid coins getting attention. By solid, I mean coins that actually has a project and some kind of revenue coming in. Currently a lot of coins are back to prices of last year, if not, then lower. This makes it a great entry point for those that wanted to get in a few months ago, but thought prices were too high. Sand's (4th) wave count has retraced to the peak of wave (1) and bounced nicely. This is usually a good indication that the bottom is in. We don't normally enter wave 1 territory unless btc does something drastic. The market sentiment is still uncertain and people are fearful, which makes it a perfect op BINANCE:SANDUSDT FTX:SANDUSD portunity for institutional investors to start investing.
SANDUSDT trade ideas

sand usdtIn the Master Traders Course, you’ll learn the mind of the market mover. You’ll understand why he does all that he does, and how. He has many tricks up his sleeve, and you’ll learn them all. Not only that, you’ll learn the rules he MUST live by, giving you a complete understanding of not only what has happened in the market, but more importantly, what WILL happen!

SANSUSDT longAfter a good correction, most of the altcoins go back to north again. One of them is sand. It's now in support area but not very clear signal yet. So I try with very small amount. Good luck..

SAND USDT 30-06-2022Boustif A signal
sell short SAND USDT 30-06-2022
15 min
3% profit
2/6 loss
scalping

SANDBOX - UPDATED CHARTMassive drop, again but we see some support here.
Could be good for day trading but mind the market is bearish so some short positions are needed. Not on this chart now as we see support at 0.99 and we wouldn't go short, only under 0.94
One Love,
the FXPROFESSOR


SANDUSDT Price closed below the 4hr ichimoku kumo. The kumo also flipped red which indicates bearish momentum. Take profit is marked by the significant fratcal support.

SAND/USDT - H 4 Adam@Eve My target price : 0.85 $ .
Prove me if I'm wrong .
Also, the Daily Stoch RSI is at the beginning of the correction .
I'm waiting for weekend to see if my stupid analysis is on the point.

sand |elliottwave| targetsTargets for this retracement on sand , follow btc also if it stops at the given target i gave .

📈Should you buy SAND after such PUMP? Only after THIS!The SAND starts to PUMP after the good news about the project making +82%. I will explain to you next entry point which can give you at least +37%.
I marked ont the chart the growing volumes and sellers activity. At SAND peaks someone sold a lot of tockens and the columes confrimed it.
Now we have to see the liquidations volume to open a long trades. But why? This guys who bought at the top will be the fule for potential sall and when they will sell theit tockens it will be our time.
1. Draw the trendline and identify the squeeze.
2. Look for the huge liquidations at the volume. If you see the big volume after dump it will be additionall confirmation to you that retail traders will have been traped.
3. BTC should also rose with the alts. It will add additional strength to SAND.
Of course, if we return to the $0,81-0,88 value area a lot of traders with laverage will be liquidated and it`s a huge support area for the price. It means that price can easily bounce from this area.
The target for this movement is $1.29-1.34 value area (+34%).
If you still have a question write it down!
💻Friends, press the "like"👍 button, write comments and share with your friends - it will be the best THANK YOU.
P.S. Personally, I open an entry if the price shows it according to my strategy.
Always do your analysis before making a trade.

Sand Analysis 29 june 2022Snad is moving in downward price channel and looks like ready for a breakout . Scalp setup is given in autoscalps

SANDBOXSAND/USDT waiting for these moves On SANDBOX these moves will make on this BOX Support is on 0.9591

sand droppingThis is a continuation from the daily TF. It will drop on the RR 1:1 first then wait to see where it will take s next.

SAND/USDT Main trendThe chart shows the main trend. Timeframe 3 days. The main trend to understand in which zone in the secondary or local trend you are working.
Coin in the coin market: SAND
This is what this secondary trend looks like on a line chart.
I want to note that the price of excess profits has been in the main trend since the beginning of trading, the coin is quite fresh.
Therefore, if the work is long, then only "pull out" the price movement without the accumulation of large positions.
If the mirror level of the “wedge support” (gray zone) is broken, then a huge potential for short-term work opens up. But at the moment I'm working with a wedge.
Observe risk management in your work and this is very important - limit possible losses with the help of a stop loss, this is very important with such excess profits. But, don't be greedy, take into account the intraday volatility of the trading instrument. If it knocks out and the pump continues to work without you, it's okay.
The reversal zones and the main levels on which the development of the trend will depend, I showed on the chart. Explore ideas for working in a minor trend in detail.
Secondary trend (a trend worth working in when an acceptable entry point occurs). Deadline 1 day. Candles. Logo.
SAND/USDT Secondary trend. Wedge

Looks pretty good to short SANDThe trend is down..get in once confirmed... a good short position. Remember the Macro is bearish!

SAND/USDT Analysis ( Update )📈📉HEY, what's up Guys and Girls?!
📌Since 26 jan , 2022 that I've posted sandusdt analysis , it has followed the correction wave and exactly reached my target ( more than 80 % (1x-short ))🎯 .
so today ,As you can see on the weekly timeframe for pair of SAND/USDT , it has been declining but recently reacted to pivot zone and jumped by more than 40 %, so if it maintain the current pivot zone , it can continue its rising at least to descending trendline as a dynamic resistance .
but If I consider the Elliot wave theory , in my opinion, the recent correction waves isn't complete ABC waves in this point of view , and was only the A wave and I think it can fall again by reaching the black descending trendline( b wave ) or if it be able to breakout the descending trendline and reaches the resistance zone( b wave) , then it can fall again to finish the 3rd wave (c). which it means it can even loses the current pivot zone as a support in both scenarios and fall on the lower support , then at there it can start a new rally.
✌️ Good luck with your trading and investing and remember: Trade smart…OR JUST DON’T TRADE!
--------------------------------------------------------------------------------------------------------------------
👉This analysis is my personal opinion ,not a financial advice ,so do your own research.
💜 if you're fan of my analyses please follow me , give a big thumbs 👍 OR drop a comment 🗯

SAND/USDT - H4 Chart Cup and HandleThis chart make sense?
Prove me if I'm wrong .
# Sand Hole
Target #1 : 0.878 $
Target #2 : 0.777 $

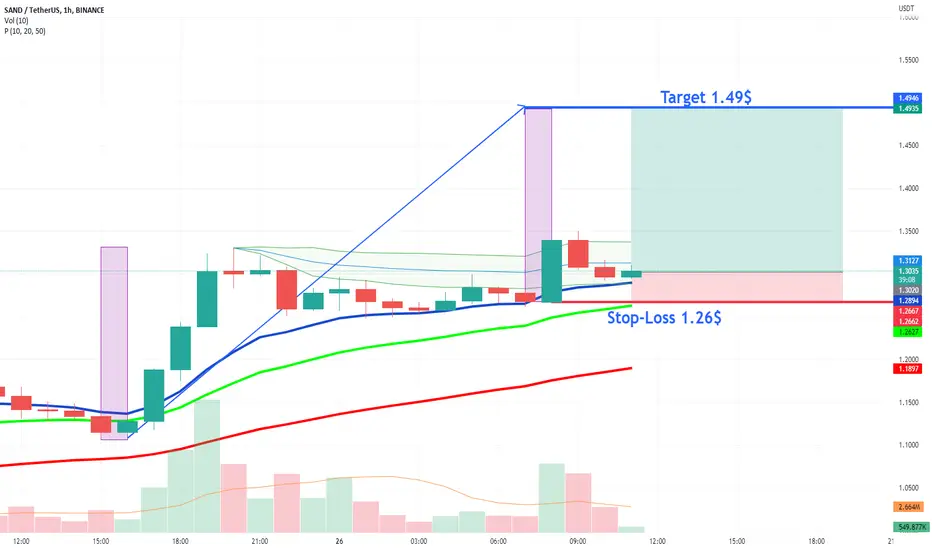
$SAND Breakout Target 1.49$#SAND Breakout 🚀 in 1h Chart and reclaim of vwap on above average volume - Target 1.49$ 🧲
All Entry Criteria have been met:
1. Price above 10, 20 & 50 EMA ✅
2. Consolidation Phase in Uptrend ✅
3. Breakout on above average Volume✅
SAND close to a new big moveSand is very close for a new leg up, if will breakdown the trend prepare for short, as BTC and ETH the down move is corrective more for a break up of the channel

Sandbox / SANDUSDT - VIP PASSBUY !
We analyze the reason (the volume ) and not the result (the price)
We rely on monitoring the entry and exit of systems that control a large amount of money.

SANDThe Sandbox is probably one of the most promising metaverse projects (backed by superstars like Snoop Dogg, Deadmau5 and so on). Last year's frenzy is clear in the chart -> 1000% in just one month is not a healty bullrun. So, of course it needed a rebalancing move. Here we are now back at 1.2$ per coin. Trade wise a "fair value" target would be around 3 dollars (where most transactions happened). If we can break that is of course heading to ATH.
Trade safe :)

Sand making double top at 4 hr resistanceSand making double top at 4 hr resistance and then clear rejection heading toward to makr another lower low

📊 SAND pumped and now it's facing resistanceHello, dear TradingView members.
This idea is a SAND analysis.
SAND had a pump and broke two resistance levels.
It is now pushing up below the upper BB, and now we are expecting
The RSI is not overbought, but it doesn't seem strong either in the buy volumes.
The price might get rejected by these two resistance levels and land on support.
The Speedometer indicator shows Buy volumes on the market for SAND on a 1D interval.
Now have in mind: ANY news about this coin can cause a big pump or dump at this moment!
Let me know if you guys have any questions;
I will be more than happy to help.
