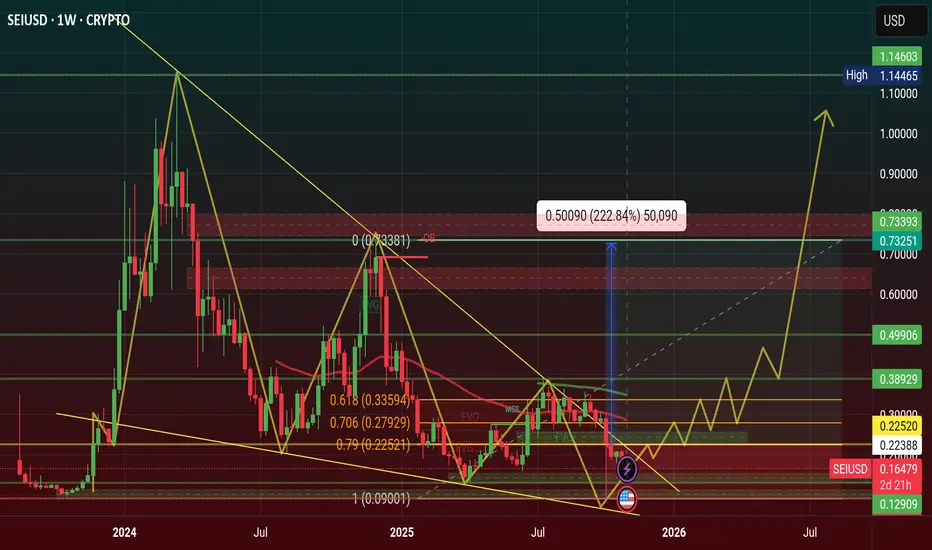
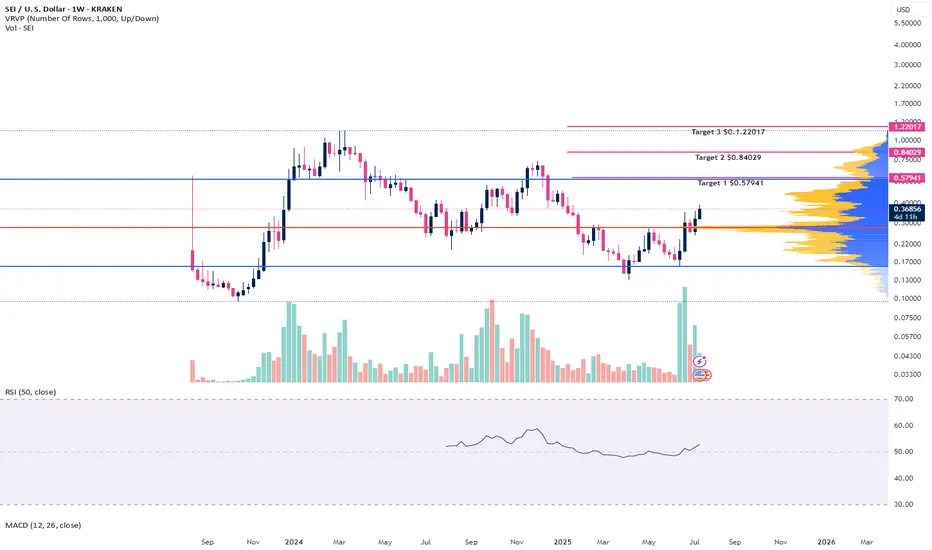
$SEI Price will hit $1.22 in 2026, Falling Wedge Pattern WeeklySEI price is showing a Bullish Pattern of Falling Wedge Pattern, when this pattern will create on chart after price will be upward direction.
Price Will hit $1.11 in 2026 and 2027 is $2.22, $3.33
Entry Point is $0.22, $0.27, $0.33 and Stoploss point $0.09
2026 Target point $0.49, $0.77, $1.11
20
SEI ready to take offSEI are ready to takeoff my target for this is above 1$ I will sale 50% at 1$ next target are 1.85 - 2.5

SEI 8H – Breakout After Fib Defense, Targeting Liquidity SEI has respected multiple Fib reactions, holding the 0.5 retracement ($0.2758) and defending the golden pocket ($0.2484) on prior dips. Price has since reclaimed both the 50 EMA ($0.302) and 200 EMA ($0.297) while riding the ascending trendline for confluence.
Upside:
Current move shows a breakou

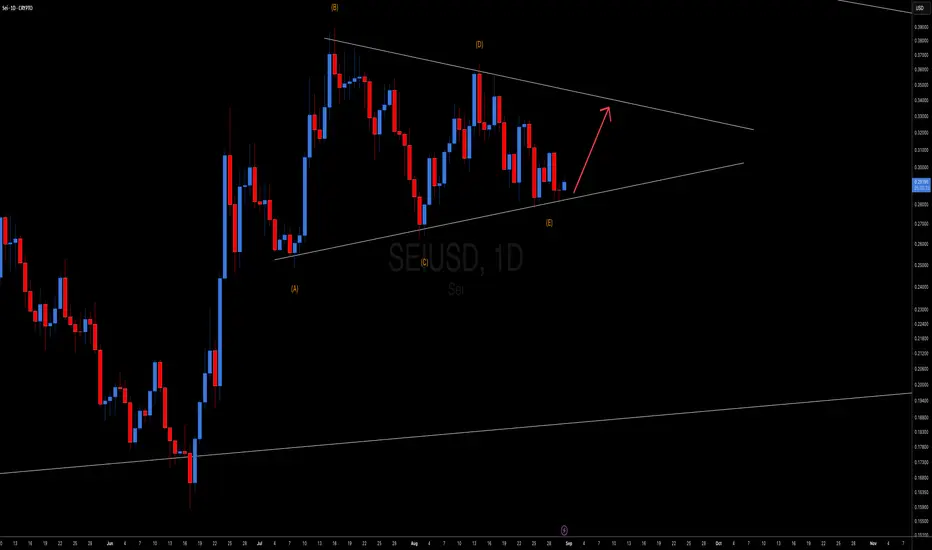
Bullish Move Up to complete Elliot Wave Triangle CorrectionBullish Move Up to complete Elliot Wave Triangle Correction
SEI 4H – Testing $0.39 Resistance After Trendline RallySEI has rallied sharply from its ascending trendline, pushing toward the $0.39–$0.40 resistance zone that capped previous highs. The Stoch RSI is deep in overbought territory, suggesting possible consolidation or a minor pullback before any breakout attempt. A confirmed move above $0.40 could target

SEI 8H – Same Fib Zone, Same Bounce… Same Outcome?SEI just tapped the exact same golden pocket zone that launched its last major breakout — and it’s already showing signs of a repeat performance. The 8H chart displays a nearly perfect mirror setup, with price double-tapping the 0.5–0.618 retracement zone and bouncing with momentum.
With Stoch RSI

SEI - MACD Liquidity Tracker Nailed the Long, Now Flipping ShortThe MACD Liquidity Tracker Strategy just clocked a +103% long trade on SEI before momentum flipped and a short signal fired on this 8H chart.
The previous long captured a textbook impulse — clean MACD crossover, EMA alignment, and breakout confirmation. Now price is back under the 50/100 EMA, and M

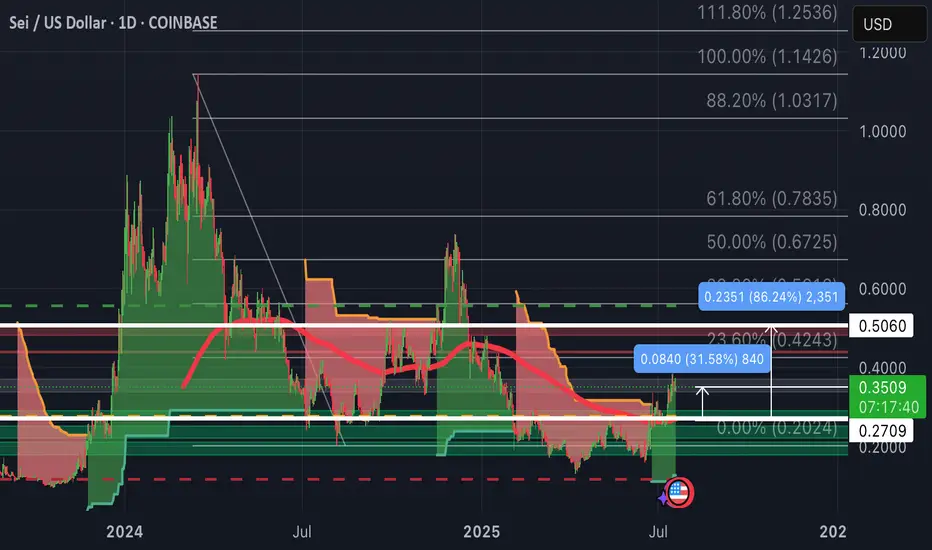
SEI-Update:Up 31% so far as we wait for the big retest back @ $1Entry was at $0.27, made a dip below this support line then recovered.
Macro retest would be 100% Fibonacci Correction back to $1.00.
First we shall break thru the $0.50 Resistance (will be a 86% gain).
Then push up past 50% Fibonacci at $0.6725, then $0.7835.
$SEIUSD - looks great for a longCOINBASE:SEIUSD
Looks great long term and targets provided should be hit by EOY.
Open active trade = $0.2930
SEI - I love the look of the chart. NYSE:SEI is a new crypto I have come across. Fundamentals look great and the chart looks even better.
I have just opened my first trade on it.
It should target $0.58 to $1.23 this cycle with a few stops along the way highlight in green.
Let's see how it plays out.
Good luck to everyone invo

See all ideas
Summarizing what the indicators are suggesting.
Oscillators
Neutral
SellBuy
Strong sellStrong buy
Strong sellSellNeutralBuyStrong buy
Oscillators
Neutral
SellBuy
Strong sellStrong buy
Strong sellSellNeutralBuyStrong buy
Summary
Neutral
SellBuy
Strong sellStrong buy
Strong sellSellNeutralBuyStrong buy
Summary
Neutral
SellBuy
Strong sellStrong buy
Strong sellSellNeutralBuyStrong buy
Summary
Neutral
SellBuy
Strong sellStrong buy
Strong sellSellNeutralBuyStrong buy
Moving Averages
Neutral
SellBuy
Strong sellStrong buy
Strong sellSellNeutralBuyStrong buy
Moving Averages
Neutral
SellBuy
Strong sellStrong buy
Strong sellSellNeutralBuyStrong buy
Displays a symbol's price movements over previous years to identify recurring trends.