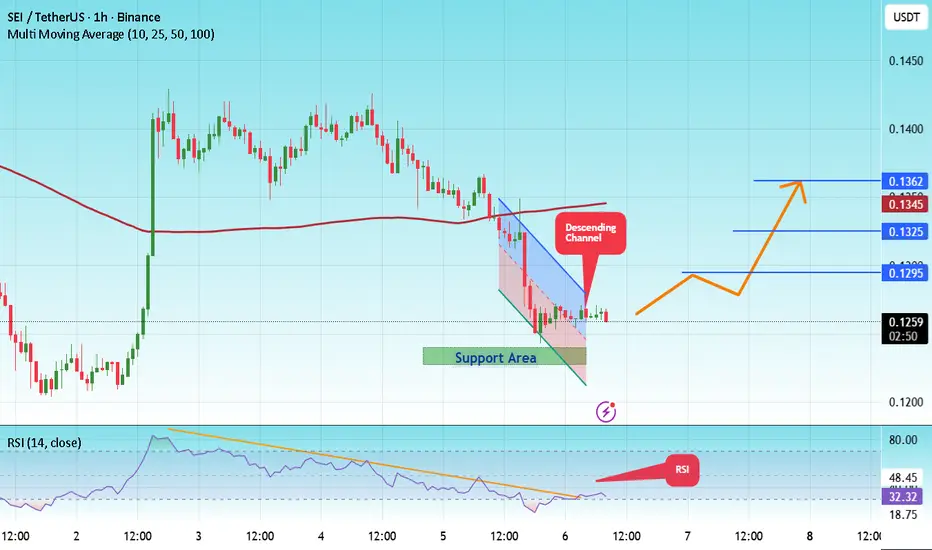
#SEI/USDT - Final Support Before a Major Reversal or Breakdown#SEI
The price is moving in a descending channel on the 1-hour timeframe. It has reached the lower boundary and is heading towards a breakout, with a retest of the upper boundary expected.
We are seeing a bearish trend in the Relative Strength Index (RSI), which has reached near the lower boundary
Related pairs
SEI/USDT — 0.11–0.092 Will Decide the Next Major Move?SEI is now approaching one of the most critical demand zones on the entire 5D chart: the 0.11–0.092 range.
This isn’t just another support area — it’s the structural base that previously triggered a major rally.
Now, price is retesting the same zone, but this time under a much weaker and clearly bea

SEI Looks Bearish (3D)First of all, pay attention to the timeframe | it’s the 3D timeframe.
It seems that, in the larger view, SEI is within a major corrective pattern, and wave D of this pattern has recently been completed.
It appears that wave E of the higher-degree corrective structure on SEI has begun. The price is

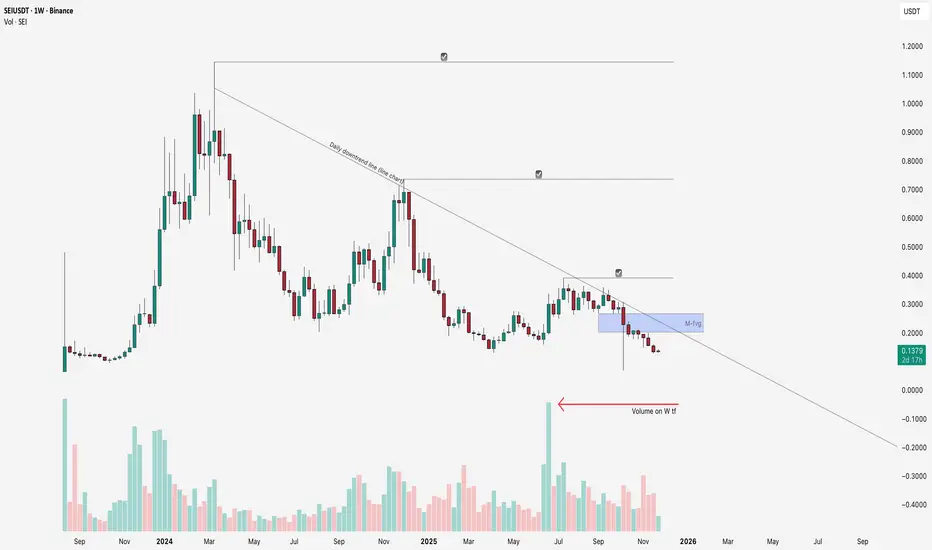
Sei need a volume for continuationIf we take a look on Weekly chart and volumes! It's so important to see new volume inflow!
Otherwise its can be long sideways till end of winter. BINANCE:SEIUSDT
The first key resistance for Sei will be Daily downtrend line (on a line chart we can cut all noise) and find out the key points!
Nex
#SEI/USDT - Final Support Before a Major Reversal or Breakdown#SEI
The price is moving within an ascending channel on the 1-hour timeframe and is adhering to it well. It is poised to break out strongly and retest the channel.
We have a downtrend line on the RSI indicator that is about to break and retest, which supports the upward move.
There is a key suppo
#SEI/USDT - Final Support Before a Major Reversal or Breakdown#SEI
The price is moving in a descending channel on the 1-hour timeframe. It has reached the lower boundary and is heading towards breaking above it, with a retest of the upper boundary expected.
We have a downtrend on the RSI indicator, which has reached near the lower boundary, and an upward reb

SEI OpportunityThe price has dropped significantly since my last analysis. SEI is currently in a bearish downtrend with strong selling pressure.
📉 Technical Structure
Current Pattern:
Trading in descending channel on 1h frame TradingView
Price action shows continued weakness
Break below key support levels
Critic

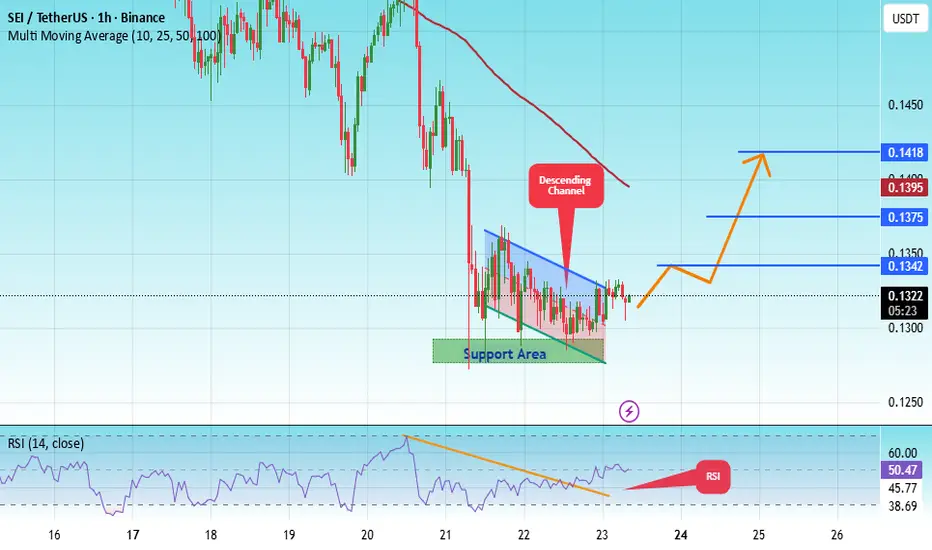
#SEI/USDT - Final Support Before a Major Reversal or Breakdown#SEI
The price is moving within an ascending channel on the 1-hour timeframe and is adhering to it well. It is poised to break out strongly and retest the channel.
We have a downtrend line on the RSI indicator that is about to break and retest, which supports the upward move.
There is a key suppo

SEI analysis#SEI Price is forming a double bottom pattern, and we may see a bounce from here. You can open a long position with a tight stop-loss. We expect a bounce towards the resistance area.
Support Area: $0.1450-$0.1520
Resistance Area: $0.1760-$0.1800

#SEI/USDT - Final Support Before a Major Reversal or Breakdown#SEI
The price is moving within an ascending channel on the 1-hour timeframe and is adhering to it well. It is poised to break out strongly and retest the channel.
We have a downtrend line on the RSI indicator that is about to break and retest, which supports the upward move.
There is a key supp

See all ideas
Summarizing what the indicators are suggesting.
Oscillators
Neutral
SellBuy
Strong sellStrong buy
Strong sellSellNeutralBuyStrong buy
Oscillators
Neutral
SellBuy
Strong sellStrong buy
Strong sellSellNeutralBuyStrong buy
Summary
Neutral
SellBuy
Strong sellStrong buy
Strong sellSellNeutralBuyStrong buy
Summary
Neutral
SellBuy
Strong sellStrong buy
Strong sellSellNeutralBuyStrong buy
Summary
Neutral
SellBuy
Strong sellStrong buy
Strong sellSellNeutralBuyStrong buy
Moving Averages
Neutral
SellBuy
Strong sellStrong buy
Strong sellSellNeutralBuyStrong buy
Moving Averages
Neutral
SellBuy
Strong sellStrong buy
Strong sellSellNeutralBuyStrong buy
Frequently Asked Questions
The current price of Sei / Tether SPOT (SEI) is 0.1387 USDT — it has risen 3.30% in the past 24 hours. Try placing this info into the context by checking out what coins are also gaining and losing at the moment and seeing SEI price chart.
Sei / Tether SPOT price has fallen by −4.01% over the last week, its month performance shows a −17.02% decrease, and as for the last year, Sei / Tether SPOT has decreased by −12.55%. See more dynamics on SEI price chart.
Keep track of coins' changes with our Crypto Coins Heatmap.
Keep track of coins' changes with our Crypto Coins Heatmap.
Sei / Tether SPOT (SEI) reached its highest price on Nov 17, 2025 — it amounted to 0.1594 USDT. Find more insights on the SEI price chart.
See the list of crypto gainers and choose what best fits your strategy.
See the list of crypto gainers and choose what best fits your strategy.
Sei / Tether SPOT (SEI) reached the lowest price of 0.1204 USDT on Dec 1, 2025. View more Sei / Tether SPOT dynamics on the price chart.
See the list of crypto losers to find unexpected opportunities.
See the list of crypto losers to find unexpected opportunities.
The safest choice when buying SEI is to go to a well-known crypto exchange. Some of the popular names are Binance, Coinbase, Kraken. But you'll have to find a reliable broker and create an account first. You can trade SEI right from TradingView charts — just choose a broker and connect to your account.
Sei / Tether SPOT (SEI) is just as reliable as any other crypto asset — this corner of the world market is highly volatile. Today, for instance, Sei / Tether SPOT is estimated as 9.37% volatile. The only thing it means is that you must prepare and examine all available information before making a decision. And if you're not sure about Sei / Tether SPOT, you can find more inspiration in our curated watchlists.
You can discuss Sei / Tether SPOT (SEI) with other users in our public chats, Minds or in the comments to Ideas.