Gold to Silver ratio: Covid crash vs Tariff crashGold to Silver ratio during Covid crash (1:120+) vs Tariff crash (1:100+). Could silver outperform gold from here? It could in my opinion.
SILVERCFD trade ideas

BEARISH SWING XAGUSD SELLFeel free to wait for a pullback to the second entry or market execute. This sell should play out within the week. Happy Trading!!!

The best Silver chart I've ever seen!Want to know why the banks are holding silver down?
LOOK AT THIS CHART THAT DATES BACK MORE THAN 200 YEARS (TO 1800).
If this shoots past 50... banks will have a BIG problem on their hands.
If the world somehow still exists by 2060, this could be crazy.

XAGUSD: 2 year Channel Up bottomed.Silver turned oversold intra day on its 1D technical outlook (RSI = 34.341, MACD = -0.553, ADX = 36.363) but recovered as it hit the bottom (HL) of the 2 year Channel Up and rebounded. It may be under the 1D MA50 but so were the lows of October 2nd 2023 and February 12th 2024 that formed the last important bottom. In the meantime the 1W RSI hit its LL trendline, an additional bullish signal. The DT Resistance and DB Support offer a great and high probability range for sideways trading, so our recommendation is to long but contain buying under the DT (TP = 34.500). If on the other hand the candle closes under the Channel Down, short and aim for the 1W MA200 (TP = 25.600).
## If you like our free content follow our profile to get more daily ideas. ##
## Comments and likes are greatly appreciated. ##

Watch Me Make $109 On GBPUSDIn this video I describe how I was able to capitalize off my current sell positions on GU from Sunday market open till today Monday morning.


SILVER: The Market Is Looking Down! Short!
My dear friends,
Today we will analyse SILVER together☺️
The price is near a wide key level
and the pair is approaching a significant decision level of 29.788 Therefore, a strong bearish reaction here could determine the next move down.We will watch for a confirmation candle, and then target the next key level of 28.884..Recommend Stop-loss is beyond the current level.
❤️Sending you lots of Love and Hugs❤️

Silver Wave Analysis – 7 April 2025- Silver reversed from the support zone
- Likely to rise to resistance level 30.75
Silver recently reversed up from the support zone between the strong support level 28.80 (which formed Double Bottom at the end of December) and the lower daily Bollinger Band.
The upward reversal from this support zone stopped the previous sharp downward correction (2) from the end of March.
Silver can be expected to rise to the next resistance level 30.75 (the former monthly low from February, acting as the resistance after it was broken at the start of April).

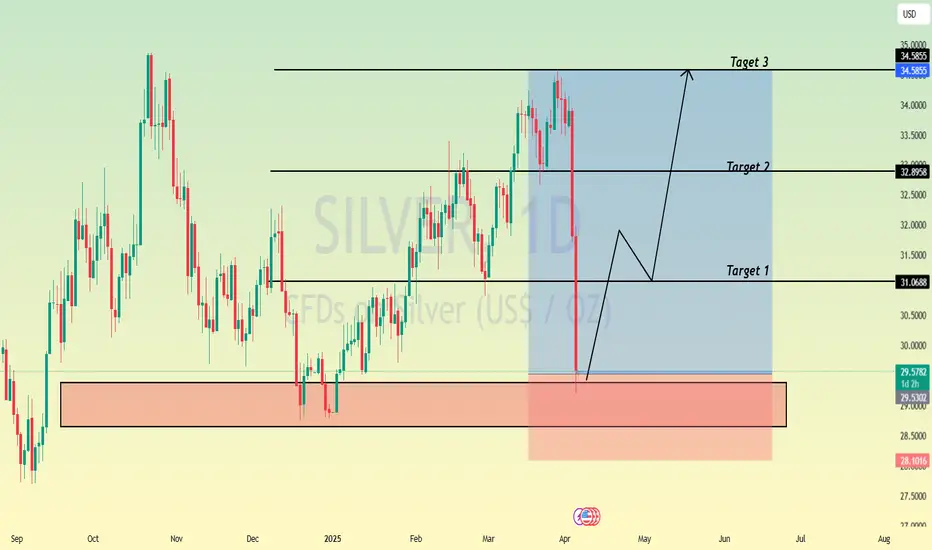
Silver’s Deep Retrace: Long Setup with Bullish Potential I’ve entered a long trade on Silver (XAG/USD) after observing a deep retrace to the 0.7 Fibonacci level on the daily timeframe. The entry at $28.96 is positioned strategically based on historical support and the current technical setup.
The stop loss is set at $26.54 to mitigate risk, while the take profit target is $36.00, aligning with a potential bullish continuation. In the bearish scenario, a break below $27.50 will prompt a reassessment and tighter risk management. Conversely, on the bullish side, breaking above $32.50 will strengthen the case for holding towards the TP.
Silver’s price action showcases its potential for a significant bounce back, supported by current geopolitical and macroeconomic conditions.
Fundamentals:
1. Federal Reserve’s Hawkish Stance:
The Fed’s updated projections for rate cuts in 2025 have pressured silver prices, as a stronger dollar and rising Treasury yields (above 4.5%) diminish the appeal of non-yielding assets. However, easing inflation in the long term could rejuvenate demand for precious metals.
2. Geopolitical Tensions:
Although silver traditionally benefits from uncertainty, recent macroeconomic headwinds, such as concerns about tariffs under the new Trump administration and sluggish global economic recovery, have overshadowed its safe-haven status.
3. Industrial Outlook:
Challenges in the industrial demand for silver, particularly from China’s solar panel production slowdown, add pressure. However, as inflation stabilizes and geopolitical risks unfold, silver could regain its industrial and safe-haven allure.
Technicals:
• Entry: $28.96
• Stop Loss: $26.54
• Take Profit: $36.00
• Key Levels:
• Bearish Scenario: Manage position below $27.50.
• Bullish Case: Strength above $32.50 confirms upward momentum.
This setup leverages a confluence of technical retracement, macroeconomic factors, and the potential for a trend reversal. Stay sharp and pay yourself as the market unfolds.
Note: Please remember to adjust this trade idea according to your individual trading conditions, including position size, broker-specific price variations, and any relevant external factors. Every trader’s situation is unique, so it’s crucial to tailor your approach to your own risk tolerance and market environment.

SILVER SENDS CLEAR BULLISH SIGNALS|LONG
SILVER SIGNAL
Trade Direction: long
Entry Level: 3,050.2
Target Level: 3,274.5
Stop Loss: 2,899.9
RISK PROFILE
Risk level: medium
Suggested risk: 1%
Timeframe: 8h
Disclosure: I am part of Trade Nation's Influencer program and receive a monthly fee for using their TradingView charts in my analysis.
✅LIKE AND COMMENT MY IDEAS✅

Silver H4 | Heading into a pullback resistanceSilver (XAG/USD) is rising towards a pullback resistance and could potentially reverse off this level to drop lower.
Sell entry is at 30.83 which is a pullback resistance.
Stop loss is at 32.20 which is a level that sits above the 61.8% Fibonacci retracement and a pullback resistance.
Take profit is at 28.80 which is a multi-swing-low support.
High Risk Investment Warning
Trading Forex/CFDs on margin carries a high level of risk and may not be suitable for all investors. Leverage can work against you.
Stratos Markets Limited (www.fxcm.com):
CFDs are complex instruments and come with a high risk of losing money rapidly due to leverage. 63% of retail investor accounts lose money when trading CFDs with this provider. You should consider whether you understand how CFDs work and whether you can afford to take the high risk of losing your money.
Stratos Europe Ltd (www.fxcm.com):
CFDs are complex instruments and come with a high risk of losing money rapidly due to leverage. 63% of retail investor accounts lose money when trading CFDs with this provider. You should consider whether you understand how CFDs work and whether you can afford to take the high risk of losing your money.
Stratos Trading Pty. Limited (www.fxcm.com):
Trading FX/CFDs carries significant risks. FXCM AU (AFSL 309763), please read the Financial Services Guide, Product Disclosure Statement, Target Market Determination and Terms of Business at www.fxcm.com
Stratos Global LLC (www.fxcm.com):
Losses can exceed deposits.
Please be advised that the information presented on TradingView is provided to FXCM (‘Company’, ‘we’) by a third-party provider (‘TFA Global Pte Ltd’). Please be reminded that you are solely responsible for the trading decisions on your account. There is a very high degree of risk involved in trading. Any information and/or content is intended entirely for research, educational and informational purposes only and does not constitute investment or consultation advice or investment strategy. The information is not tailored to the investment needs of any specific person and therefore does not involve a consideration of any of the investment objectives, financial situation or needs of any viewer that may receive it. Kindly also note that past performance is not a reliable indicator of future results. Actual results may differ materially from those anticipated in forward-looking or past performance statements. We assume no liability as to the accuracy or completeness of any of the information and/or content provided herein and the Company cannot be held responsible for any omission, mistake nor for any loss or damage including without limitation to any loss of profit which may arise from reliance on any information supplied by TFA Global Pte Ltd.
The speaker(s) is neither an employee, agent nor representative of FXCM and is therefore acting independently. The opinions given are their own, constitute general market commentary, and do not constitute the opinion or advice of FXCM or any form of personal or investment advice. FXCM neither endorses nor guarantees offerings of third-party speakers, nor is FXCM responsible for the content, veracity or opinions of third-party speakers, presenters or participants.

Silver Rebounds Sharply on Risk AversionSilver rebounded Monday, rising 2.3% to $30.22 an ounce after hitting a seven-month low. The recovery followed sharp market volatility and recession fears from rising U.S.-China trade tensions. While silver benefits from safe-haven demand, its industrial use remains a weakness. Broader market sell-offs could keep price action choppy, but intensified risk aversion and Fed easing could support silver demand.
If silver breaks above $30.90, resistance levels are at $31.40 and $32.50. Support stands at $29.00, followed by $28.40 and $27.50.

Long SLVThis is a long term trade which may take longer time to develop and contingent on positive price action through key resistance levels.
First level to watch is the 30 handle, which is currently being tested. Break above 30 should take us close to the most recent high in Oct-2024, just below the 35 handle.
Assuming price action advances past the 35 handle, we'd likely see a quick move to new highs around the 52 handle.
Additional rate cuts in 2025, as well as increased deficit spending would likely be the fundamental monetary catalyst to drive prices higher.

SILVER(Top-Down to H1 Analysis)A simple chart Analysis.Defining the Entry and the 2 Exit Strategy(TP & SL)..You can comment in the section below and Follow for more Video Analysis..ENJOY!!

Damage Control Silver Long after Hitting mass stoplossIn order to hunt liquidity silver breaks below with power to hit stoplosses of masses and then goes towards the trade that it intended to go first.
So to counter the initial damage I added another trade to damage control with low risk,

SILVER - BEARISH SCENARIOHello Traders !
After a huge bearish move,
The silver price reached the support level (28.70 - 29.0).
So, let's expect the bearish scenario:
If the market breaks below the support level and closes below that,
We will see a new bearish move📉
TARGET: 26.65🎯
Previous Analysis:

Silver is in the bullish trend after testing supportHello Traders
In This Chart XAGUSD HOURLY Forex Forecast By FOREX PLANET
today XAGUSD analysis 👆
🟢This Chart includes_ (XAGUSD market update)
🟢What is The Next Opportunity on XAGUSD Market
🟢how to Enter to the Valid Entry With Assurance Profit
This CHART is For Trader's that Want to Improve Their Technical Analysis Skills and Their Trading By Understanding How To Analyze The Market Using Multiple Timeframes and Understanding The Bigger Picture on the Charts
#XAGUSD – Silver OutlookHere’s your refined and engaging version of the **#XAGUSD (Silver)** analysis, with improved grammar, flow, and added emojis for platforms like TradingView, Instagram, or Telegram:
---
## ⚪ **#XAGUSD – Silver Outlook**
🔮 **What I'm Watching:**
Price is likely to **tap into the Daily Order Block** in the **$28.40–$29.00** area,
which aligns closely with the **0.50 Fibonacci retracement** level 📏.
📌 This zone could act as a **strong reaction point** for buyers.
🕵️ **What to Look For:**
If silver shows **bullish rejection signs** from this zone — ideally a **bullish H4 candle** forming right after tapping it —
then a **small buy setup** could be considered 🎯.
---
📌 As always, wait for proper confirmation — don’t jump in blindly.
Want me to make a visual version for Instagram or share a lower timeframe setup next?
---

Silver Long IdeaI have placed this idea by looking the previous support and resistent zone. lets see whether it plays or not.

Silver Long IdeaI am presenting silver idea for long. You should just watch it and then see weather it playsout or not.

XAGUSD Weekly Analysis – Double Top Formation & Breakdown🧱 Chart Pattern Identified: Double Top Formation
The chart displays a classic Double Top pattern, a bearish reversal structure typically found at the end of an uptrend. This pattern forms when price reaches a resistance level twice, fails to break above it both times, and eventually breaks the neckline/support level, confirming a shift in market sentiment.
🔍 Key Components of the Chart:
1. Resistance Level (Tops) – ~$34.25
The market formed two significant peaks around the same level — labeled Top 1 and Top 2.
This level has proven strong resistance, as price was rejected both times after testing this zone.
This zone is marked with a light orange rectangle and a horizontal blue line labeled "Resistance Level".
2. Support Level (Neckline) – ~$28.80
This level served as the neckline of the Double Top.
After the second top, the price sharply declined and is currently approaching this key support zone, highlighted again in light orange.
A clean break and close below this zone on the weekly timeframe will be a strong confirmation of the bearish reversal.
3. Trendline Break – Bearish Shift in Momentum
A rising black dashed trendline supported the prior uptrend.
Price action has now broken below this trendline with strong bearish momentum, indicating that buyers have lost control.
This trendline break adds confluence to the bearish setup, supporting the validity of the pattern.
4. Bearish Projection Target – ~$22.47
The target is projected using the height of the Double Top pattern.
Measured from the resistance level ($34.25) to the support ($28.80), the vertical distance is ~5.45 USD.
Subtracting this from the neckline gives us a projected target:
28.80 - 5.45 = ~23.35 (rounded down to ~22.47 for technical cluster support).
This target area is marked with a blue arrow and labeled "Target" near the horizontal support at $22.47.
5. Stop Loss – ~$34.25
The logical invalidation point is placed just above the resistance zone and the second top.
A move above this level would invalidate the double top pattern, signaling that bulls have regained control.
📈 Price Action and Candlestick Behavior
The strong bearish weekly candle that broke below the trendline shows a decisive shift in sentiment.
The candle's large body and long range confirm institutional selling interest.
Volume (if shown) would likely support the move, but even price structure alone is highly telling here.
🎯 Trading Strategy & Setup
Component Details
Entry On a confirmed break and retest of $28.80 support (neckline)
Stop Loss Above $34.25 (Top 2)
Target $22.47
Risk/Reward ~1:2 or better
Timeframe Weekly (Swing Trade)
Bias Bearish
🧠 Concluding Notes
This chart provides a high-probability bearish setup rooted in classical charting principles. The Double Top is one of the most reliable reversal patterns, especially when:
Formed after a prolonged uptrend (as seen here),
Confirmed with a trendline break,
Followed by strong bearish momentum toward the neckline.
Traders should monitor the support zone around $28.80 closely for a potential breakdown. If confirmed, the target near $22.47 becomes a realistic medium-term objective.

Silver : Sell signal Triggered Silver : Sell signal Triggered .
MACD also took a nose dive.
( Not a Buy / Sell Recommendation
Do your own due diligence ,Market is subject to risks, This is my own view and for learning only .)

SILVER Strong Support Ahead! Buy!
Hello,Traders!
SILVER got decimated
By the bears last week
And lost almost 15%
Of its value, which is
Clearly an overreaction
And an oversold situation
So after the potential retet
Of the strong horizontal
Support below around 28.97$
On Monday we are likely
To see a bullish correction
Buy!
Comment and subscribe to help us grow!
Check out other forecasts below too!
Disclosure: I am part of Trade Nation's Influencer program and receive a monthly fee for using their TradingView charts in my analysis.
