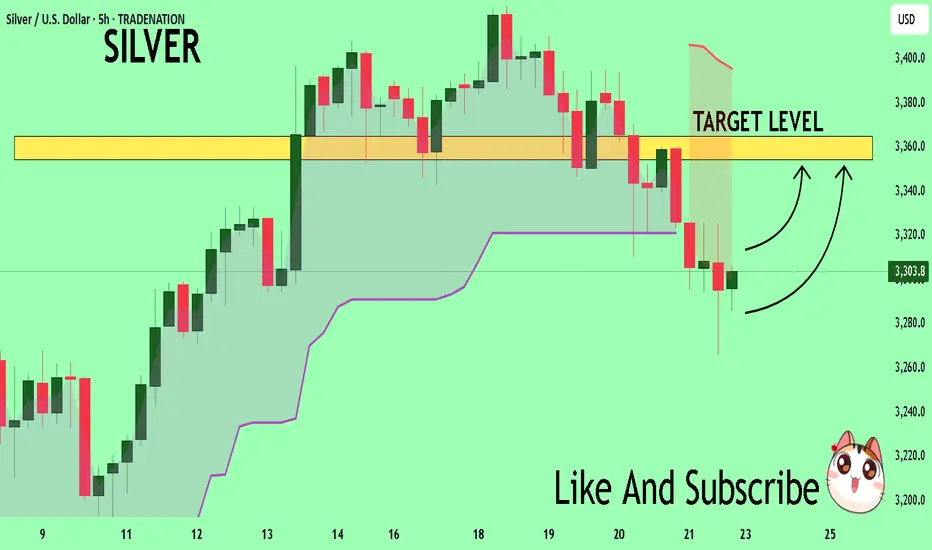
SILVER Set To Grow! BUY!
My dear subscribers,
My technical analysis for SILVER is below:
The price is coiling around a solid key level - 3303.8
Bias -Bullish
Technical Indicators: Pivot Points Low anticipates a potential price reversal.
Super trend shows a clear buy, giving a perfect indicators' convergence.
Goal - 3354.4
About Used Indicators:
By the very nature of the supertrend indicator, it offers firm support and resistance levels for traders to enter and exit trades. Additionally, it also provides signals for setting stop losses
Disclosure: I am part of Trade Nation's Influencer program and receive a monthly fee for using their TradingView charts in my analysis.
———————————
WISH YOU ALL LUCK
SILVERCFD trade ideas
SILVER bullish and overbought at the new ATH SILVER bullish and overbought at the new ATH
Trend Overview:
Silver remains in a bullish trend, supported by an ongoing uptrend. However, a corrective pullback could present potential buying opportunities at key support levels.
Key Levels:
Support: 3400 (critical level), 3332, 3240
Resistance: 3440, 3488, 3555
Bullish Scenario:
A pullback to 3400 followed by a strong bounce could confirm support and drive prices towards 3440, with extended targets at 3488 and 3555 over the longer term.
Bearish Scenario:
A daily close below 3400 would invalidate the bullish outlook, signaling further downside towards 3332 and possibly 3240 in an extended correction.
Conclusion:
The bullish trend remains intact, but 3400 is the key level to watch. Holding above it supports further upside, while a break below could trigger a deeper retracement. Traders should watch for price action confirmation at support and resistance levels for trade setups.
This communication is for informational purposes only and should not be viewed as any form of recommendation as to a particular course of action or as investment advice. It is not intended as an offer or solicitation for the purchase or sale of any financial instrument or as an official confirmation of any transaction. Opinions, estimates and assumptions expressed herein are made as of the date of this communication and are subject to change without notice. This communication has been prepared based upon information, including market prices, data and other information, believed to be reliable; however, Trade Nation does not warrant its completeness or accuracy. All market prices and market data contained in or attached to this communication are indicative and subject to change without notice.

Ongoing "Ninja" bull markets for silver and the miners.Ongoing "Ninja" bull markets for silver and the miners.
Now, watch silver hold its ground against the stock markets.
Still so early.

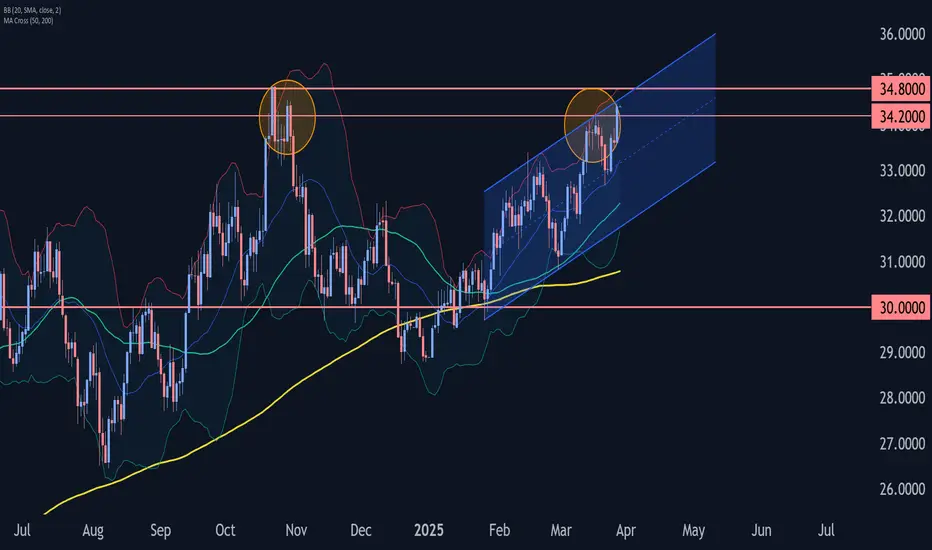
Silver (XAG/USD) Rising Wedge – Bearish Breakdown Setup!A rising wedge is a pattern that typically forms when the price makes higher highs and higher lows, but the upward momentum starts weakening. The narrowing structure of the wedge indicates that buyers are losing strength, and a breakout to the downside is likely.
Key Characteristics of the Rising Wedge:
✔ Higher highs & higher lows – but with reduced momentum
✔ Trendline support (lower boundary) & resistance (upper boundary)
✔ Volume decline – suggests a potential reversal
Expected Scenario:
If the price breaks below the lower trendline, it signals bearish pressure, and Silver could see a strong decline.
2. Key Levels & Trading Setup
📌 Resistance Level ($34.50 - $34.80)
The upper boundary of the wedge is acting as strong resistance.
Historically, this zone has rejected price action multiple times, indicating sellers are defending this area.
📌 Support Level ($30.20 - $30.50)
A major demand zone where buyers previously stepped in.
If the wedge breaks down, this is the most likely target for the decline.
📌 Stop Loss ($34.81)
Placed just above the recent high and resistance zone to limit risk in case of an unexpected upside breakout.
📌 Target ($30.20)
Measured move from the wedge breakdown projects a sharp decline toward the next strong support at $30.20.
3. Trade Execution Strategy
🔴 Bearish Breakdown Scenario
If the price breaks below the lower trendline (around $33.00), we expect a strong move downward.
📉 Short Entry: Below $33.00 (after confirmation)
🎯 Target: $30.20
❌ Stop Loss: $34.81 (above resistance)
Confirmation Needed:
✅ Strong bearish candle close below support
✅ Increased volume during breakdown
✅ Retest of broken support turning into resistance
🟢 Bullish Alternative (Invalidation)
If price breaks and holds above $34.81, the bearish setup will be invalidated, and a breakout towards $36.00 - $37.00 could be expected.
4. Additional Considerations
📌 Fundamental Factors: Keep an eye on macroeconomic news, Fed decisions, and USD strength, as these impact Silver prices.
📌 Risk Management: Avoid overleveraging and use a proper risk-reward ratio (1:3 or higher).
📌 Market Sentiment: Watch volume trends and confirm breakout or fakeout before entering trades.
Conclusion
This chart presents a high-probability short trade setup based on the rising wedge breakdown.
If the breakdown occurs, Silver could drop toward the $30.20 support zone. However, traders should wait for confirmation before entering to avoid fakeouts.
Would you like me to refine this further for a TradingView post? 🚀


SILVER (XAGUSD): One More Important BreakoutSILVER was accumulating within a tight trading range on a 4H time frame for nearly two days.
The release of recent fundamental news caused a significant uptrend, breaking through the range resistance and a key daily resistance level with a high momentum bullish candle.
The previously broken levels are now acting as support. I believe that the bullish momentum could continue, possibly reaching 34.80.

Silver Bearish Opportunity – Reversal Signals from Overbought ZSilver (XAG/USD) recently topped out near $33.85 and is now showing strong signs of a potential bearish reversal. Momentum indicators are cooling off, and price action is breaking below short-term support with a clear shift in sentiment.
🔍 Technical Highlights:
✅ Rejection from resistance near $33.85
✅ Bearish MACD cross with growing downside momentum
✅ RSI dropping from overbought territory
✅ Loss of 9 EMA support
✅ Lower high forming after sharp rally
✅ Weakening momentum following extended upside move
📉 Trade Setup:
🔴 Entry Zone: Current levels ($33.58–33.60)
🛑 Stop Loss: Above $33.86 (recent swing high)
✅ TP1: $33.35 – minor support
✅ TP2: $33.15 – previous structure level
✅ TP3: $32.90 – major horizontal support
📌 I’ve taken a short position here with a tight stop and a clean risk/reward profile. Watching for continuation as momentum shifts to the downside.
Let’s see how this unfolds 👀📉

Silver H4 | Approaching pullback supportSilver (XAG/USD) is falling towards a pullback support and could potentially bounce off this level to climb higher.
Buy entry is at 34.10 which is a pullback support that aligns close to the 23.6% Fibonacci retracement level.
Stop loss is at 33.68 which is a level that lies underneath a pullback support and the 38.2% Fibonacci retracement level.
Take profit is at 34.64 which is a level that aligns with the 127.2% Fibonacci extension.
High Risk Investment Warning
Trading Forex/CFDs on margin carries a high level of risk and may not be suitable for all investors. Leverage can work against you.
Stratos Markets Limited (www.fxcm.com):
CFDs are complex instruments and come with a high risk of losing money rapidly due to leverage. 63% of retail investor accounts lose money when trading CFDs with this provider. You should consider whether you understand how CFDs work and whether you can afford to take the high risk of losing your money.
Stratos Europe Ltd (www.fxcm.com):
CFDs are complex instruments and come with a high risk of losing money rapidly due to leverage. 63% of retail investor accounts lose money when trading CFDs with this provider. You should consider whether you understand how CFDs work and whether you can afford to take the high risk of losing your money.
Stratos Trading Pty. Limited (www.fxcm.com):
Trading FX/CFDs carries significant risks. FXCM AU (AFSL 309763), please read the Financial Services Guide, Product Disclosure Statement, Target Market Determination and Terms of Business at www.fxcm.com
Stratos Global LLC (www.fxcm.com):
Losses can exceed deposits.
Please be advised that the information presented on TradingView is provided to FXCM (‘Company’, ‘we’) by a third-party provider (‘TFA Global Pte Ltd’). Please be reminded that you are solely responsible for the trading decisions on your account. There is a very high degree of risk involved in trading. Any information and/or content is intended entirely for research, educational and informational purposes only and does not constitute investment or consultation advice or investment strategy. The information is not tailored to the investment needs of any specific person and therefore does not involve a consideration of any of the investment objectives, financial situation or needs of any viewer that may receive it. Kindly also note that past performance is not a reliable indicator of future results. Actual results may differ materially from those anticipated in forward-looking or past performance statements. We assume no liability as to the accuracy or completeness of any of the information and/or content provided herein and the Company cannot be held responsible for any omission, mistake nor for any loss or damage including without limitation to any loss of profit which may arise from reliance on any information supplied by TFA Global Pte Ltd.
The speaker(s) is neither an employee, agent nor representative of FXCM and is therefore acting independently. The opinions given are their own, constitute general market commentary, and do not constitute the opinion or advice of FXCM or any form of personal or investment advice. FXCM neither endorses nor guarantees offerings of third party speakers, nor is FXCM responsible for the content, veracity or opinions of third-party speakers, presenters or participants.

XAGUSDXAGUSD
- Bullish Channel as an Corrective Pattern in Long Time Frame
- Break of Structure
- RSI - Divergence
- S / R Level
- Completed " 123 " Impulsive Waves

Buying silver from 34.1 , limit order placedSilver is looking bullish , looking for 1:1 RR quick setup

Silver Bulls in Control as $34.87 Retest Comes Into ViewThe bullish move in silver we anticipated has played out nicely following the break of wedge resistance earlier this week, with the price squeezing above $34.24 on Thursday. Bulls will now be eyeing a retest of the October 24 swing high of $34.87.
Momentum indicators such as RSI (14) and MACD are trending higher, reinforcing the bullish setup and favouring buying dips and bullish breaks.
A retrace back toward $34.24 would create a setup where longs could be established above the level with a stop beneath for protection. While resistance may emerge around $34.50, $34.87 screens as a more appropriate target for those seeking greater risk-reward. A break above that would leave silver trading at multi-decade highs.
If silver were to reverse and close beneath $34.24, the bullish bias would be invalidated.
Good luck!
DS

Silver Wave Analysis – 27 March 2025
- Silver broke resistance area
- Likely to rise to resistance level 34.80
Silver recently broke the resistance area between the key resistance level 34.20 (top of the previous impulse wave i) and the resistance trendline of the daily up channel from January.
The breakout of this resistance area accelerated the active impulse wave iii of the higher impulse waves 3 and (C).
Given the clear daily uptrend, Silver can be expected to rise to the next resistance level 34.80 (former multi-month high from October) – from where the downward correction is likely.
silversilver will continue to surge ,the metal is in high demand for solar pv panel and military complex equipment manufacturing.

SILVER BULLISH BREAKOUT|LONG|
✅SILVER is trading in a
Strong uptrend and the price
Made a bullish breakout of the
Key horizontal level of 3420$
On the trade war fears
Which reinforces our bullish
Bias and makes us expect a
Further bullish move up
LONG🚀
✅Like and subscribe to never miss a new idea!✅
Disclosure: I am part of Trade Nation's Influencer program a nd receive a monthly fee for using their TradingView charts in my analysis.

SILVER - Important BreakoutHello Traders !
The Silver price broke the resistance level (33.390 - 32.900).
This key level becomes new support !
So, I expect a bullish move🚀
______________
TARGET: 34.400🎯

Silver Approaching ATH – Major Breakout Incoming?Silver is showing a strong bullish structure on the weekly timeframe. The price has been consistently forming Higher Highs (HH) and Higher Lows (HL), respecting a long-term ascending trendline that’s acting as dynamic support. This trendline has held multiple pullbacks, confirming strong underlying demand.
Currently, Silver is approaching its All-Time High (ATH) resistance near $34.83 while testing the upper resistance trendline of an ascending channel. A clean breakout above this level could trigger a major rally, potentially setting a new ATH. If the price faces rejection, a healthy pullback toward the support zone around $30 could offer another long-entry opportunity.
The structure remains bullish as long as Silver holds above the trendline support. A successful breakout above $34.83 could lead to a strong bullish continuation.
Still DYOR, NFA
Found this analysis helpful? Don’t forget to like, drop a comment, and follow us for more insights. Thanks for the love!

XAG/USD For Bullishwait for pull-back near by entry point and then go long
general trend is up trend
have fun :)

SILVER-XAGUSD(Understanding the Market)Stop relaying on Signals,because it does not help you..So if you relay on signal without understanding the market,you will end up short..What we provide here is just market Analysis..

Silver - good buying opportunityFrom the current level or more reliably after breaking the previous resistance at 33.95.
The first target - 34.80.
Considering external political and economic factors, I believe the current uptrend will continue even after reaching the first target.

Silver Insights: Aggressive Strategies and Bullish SentimentHello, friends! I’m excited to share some observations on Silver.
Yesterday, I came across a couple of intriguing portfolios focused on this metal.
The first one is an aggressive call spread at $40-$40.25, while the second portfolio is a "butterfly" spread, positioned slightly lower.
Both portfolios are designed to capitalize on price movement, but the first one could yield a threefold profit with just a little push in its direction. The second one, however, will require some time and ideally needs to reach around $38 by the end of April.
From a technical standpoint, the chart shows a "spring compression", which often leads to the emergence of such portfolios. While I don’t place too much weight on predictive elements, the sentiment remains bullish.
Stay tuned, plan your trades and let’s see how this unfolds!
Always do your own research but do no hesistate visit us to leverage the comprehensive analysis from our team to enhance your trading advantage! 💪💼


SILVER(Understanding Structures)Simple video Analysis.Note that this Analysis is not valid when Price Break the low at 33.505
