XAGUSDBullish trend to continue. Consolidation box breakout. Target should be 34.235 with SL at 33.505
SILVERCFD trade ideas

Silver - ExtensionSilver is gaining some momentum. I believe that it is going through an extension of wave 3 that should rise to test $40. Maintaining upward momentum and remaining in the current channel, a test of the all time highs is inevitable.

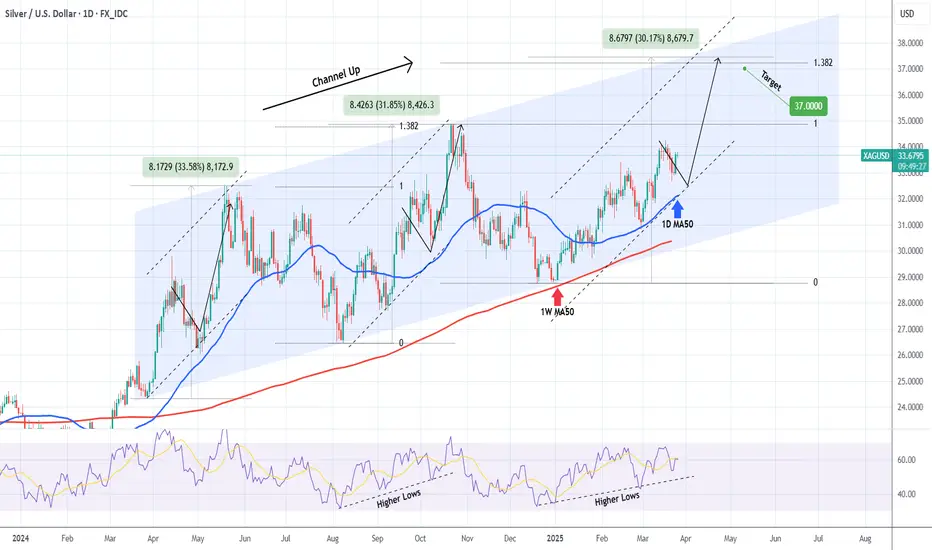
XAGUSD Channel Up aiming for the new Higher High.Silver (XAGUSD) has been trading within a Channel Up for exactly year (since the March 27 2024 Low). Its current Bullish Leg started on the December 31 2024 (Higher) Low after almost touching the 1W MA50 (red trend-line).
Once the price broke above the 1D MA50 (blue trend-line) on January 28 2025, it remained above it ever since, which is what happened on both previous Bullish Legs. We expect a +30% rise and a test of the 1.382 Fibonacci extension as the previous Higher Highs. Our Target is just below that at 37.000.
-------------------------------------------------------------------------------
** Please LIKE 👍, FOLLOW ✅, SHARE 🙌 and COMMENT ✍ if you enjoy this idea! Also share your ideas and charts in the comments section below! This is best way to keep it relevant, support us, keep the content here free and allow the idea to reach as many people as possible. **
-------------------------------------------------------------------------------
💸💸💸💸💸💸
👇 👇 👇 👇 👇 👇
Silver (XAG/USD) – Rising Wedge Breakdown & Retest📌 Overview of the Chart
The chart illustrates a classic Rising Wedge pattern that has broken down, signaling a potential bearish continuation. The price action respected technical structures, including support and resistance levels, trendlines, and key psychological zones.
The breakdown of the rising wedge led to a sharp decline, followed by a retest of the previous support as resistance, confirming further downside momentum. Traders analyzing this setup can identify clear entry points, stop-loss placements, and target objectives based on price action behavior.
🔹 1️⃣ Understanding the Rising Wedge Pattern
A Rising Wedge is a bearish pattern that forms when price moves upward within converging trendlines. It indicates that buying momentum is slowing, and a potential reversal or breakdown is imminent.
✔ Characteristics of the Rising Wedge on This Chart:
📈 Higher Highs and Higher Lows: The price was trending upwards, but the narrowing structure indicated exhaustion.
📊 Decreasing Momentum: Volume likely started declining as the price approached resistance.
📉 Bearish Breakdown: Price broke below the lower trendline, confirming the pattern’s bearish nature.
🔻 What Happened Next?
The price dropped sharply after the wedge breakdown.
A retest of the broken trendline acted as a confirmation of resistance.
The downtrend continued, targeting a lower support level.
🔹 2️⃣ Key Support & Resistance Levels
🔵 Major Resistance – 34.27 USD (All-Time High & Supply Zone)
This level served as a strong supply zone, rejecting multiple bullish attempts.
Price struggled to break this level, leading to a sell-off.
The stop-loss for short trades is placed above this zone to minimize risk.
🟠 Support Level – 32.80 USD (Previous Support Turned Resistance)
This was a key support zone before the wedge breakdown.
Once broken, price retested this level and faced rejection, confirming a trend shift.
⚫ Trendline Support (Now Broken)
The lower support trendline was a crucial guide for bulls.
Once price broke below, it signaled strong bearish control.
A retest of the trendline was unsuccessful, confirming a bearish continuation.
🟢 Target Zone – 31.93 USD (Projected Breakdown Target)
The measured move target of the rising wedge aligns around 31.93 USD.
If selling pressure continues, price may reach this level.
🔹 3️⃣ Trading Strategy – Short Setup & Execution
This setup provides a high-probability short trade based on the pattern breakdown.
📉 Short (Sell) Entry Criteria:
✅ Entry Zone: After the price broke below the wedge and retested the trendline (~33.80 USD).
✅ Confirmation:
Bearish candlestick formations (Doji, Engulfing, or Pin Bars).
Increased volume on bearish moves.
🚫 Stop-Loss Placement:
🔹 Above the resistance level (34.27 USD) – If price breaks above this, the setup is invalid.
🔹 Reasoning: Protects against unexpected bullish reversals.
🎯 Take-Profit Target:
🔻 Target Price: 31.93 USD (based on measured move projection).
🔻 Risk-Reward Ratio: At least 2:1 (adjusted based on volatility).
🔹 4️⃣ Market Psychology & Price Action Analysis
Understanding trader sentiment is crucial:
📌 Before the Breakdown:
Bulls were in control, pushing price higher.
However, momentum slowed down, forming the rising wedge.
Traders who identified this pattern anticipated a potential trend reversal.
📌 After the Breakdown:
Sellers overpowered buyers, causing a rapid break of structure.
The price retested the previous support as resistance, confirming further downside.
The market sentiment shifted to bearish, aligning with technical confirmations.
🔹 5️⃣ Alternative Scenarios & Risk Factors
🔄 Bullish Reversal (Invalidation of Bearish Bias)
🚨 If price reclaims 34.00-34.27 USD, it invalidates the bearish setup.
📌 A break above this level could trigger a new bullish wave, targeting higher highs.
⚠️ Key Risk Factors:
Unexpected macroeconomic events (e.g., Fed policy, inflation data, geopolitical tensions).
Strong bullish rejection at lower support zones (~32.00 USD).
Volume divergence (if selling volume dries up, bears may lose control).
📢 Conclusion: High-Probability Bearish Trade with Clear Risk Management
This rising wedge breakdown provides a strong short setup, with technical confirmations and price structure supporting further downside movement.
📉 Bearish Bias Until 31.93 USD
A breakdown retest suggests sellers remain in control.
Price is expected to continue lower unless bulls regain 34.00+ levels.
🔍 Key Trading Question:
Will Silver (XAG/USD) continue to its measured target of 31.93 USD, or will bulls defend key support and push prices higher?
Let’s discuss! 🚀👇

XAG/USD (Silver) 4H Trading Analysis📍 Current Price: 33.0990 (Near Entry Zone)
🔹 Trading Setup:
🟢 Entry Zone: 32.97654
🔴 Stop-Loss (SL): 32.48368 ❌
🔵 Take-Profit (TP) Levels:
TP1: 33.30512 🎯
TP2: 33.62431 🎯🎯
Final Target: 34.19599 🚀
📊 Price Action Insights:
✅ Bounce from Demand Zone (Gray Box) 📈
✅ Potential Bullish Move if price holds above entry 🚀
⚠️ Risk if SL is hit (Red Box) ❌

Silver Rises as Markets Eye Trump TariffsSilver rose above $33 on Tuesday, rebounding as trade and economic concerns supported safe-haven demand. Hopes that Trump may adopt a more targeted tariff plan ahead of the April 2 deadline offered some relief, though his new pledges to tax autos and pharmaceuticals added uncertainty. Expectations of further Fed rate cuts also supported silver. Markets now anticipate one cut in June, another in September, and growing chances of a third in December.
If silver breaks above $33.80, the next resistance levels are $34.05 and $34.85. On the downside, support is at $33.10, with further levels at $32.50 and $32.15 if selling pressure increases.

Silver H1 | Falling to an overlap supportSilver (XAG/USD) is falling towards an overlap support and could potentially bounce off this level to climb higher.
Buy entry is at 33.56 which is an overlap support that aligns with the 23.6% Fibonacci retracement.
Stop loss is at 33.15 which is a level that lies underneath an overlap support and the 50.0% Fibonacci retracement.
Take profit is at 34.18 which is a swing-high resistance.
High Risk Investment Warning
Trading Forex/CFDs on margin carries a high level of risk and may not be suitable for all investors. Leverage can work against you.
Stratos Markets Limited (www.fxcm.com):
CFDs are complex instruments and come with a high risk of losing money rapidly due to leverage. 63% of retail investor accounts lose money when trading CFDs with this provider. You should consider whether you understand how CFDs work and whether you can afford to take the high risk of losing your money.
Stratos Europe Ltd (www.fxcm.com):
CFDs are complex instruments and come with a high risk of losing money rapidly due to leverage. 63% of retail investor accounts lose money when trading CFDs with this provider. You should consider whether you understand how CFDs work and whether you can afford to take the high risk of losing your money.
Stratos Trading Pty. Limited (www.fxcm.com):
Trading FX/CFDs carries significant risks. FXCM AU (AFSL 309763), please read the Financial Services Guide, Product Disclosure Statement, Target Market Determination and Terms of Business at www.fxcm.com
Stratos Global LLC (www.fxcm.com):
Losses can exceed deposits.
Please be advised that the information presented on TradingView is provided to FXCM (‘Company’, ‘we’) by a third-party provider (‘TFA Global Pte Ltd’). Please be reminded that you are solely responsible for the trading decisions on your account. There is a very high degree of risk involved in trading. Any information and/or content is intended entirely for research, educational and informational purposes only and does not constitute investment or consultation advice or investment strategy. The information is not tailored to the investment needs of any specific person and therefore does not involve a consideration of any of the investment objectives, financial situation or needs of any viewer that may receive it. Kindly also note that past performance is not a reliable indicator of future results. Actual results may differ materially from those anticipated in forward-looking or past performance statements. We assume no liability as to the accuracy or completeness of any of the information and/or content provided herein and the Company cannot be held responsible for any omission, mistake nor for any loss or damage including without limitation to any loss of profit which may arise from reliance on any information supplied by TFA Global Pte Ltd.
The speaker(s) is neither an employee, agent nor representative of FXCM and is therefore acting independently. The opinions given are their own, constitute general market commentary, and do not constitute the opinion or advice of FXCM or any form of personal or investment advice. FXCM neither endorses nor guarantees offerings of third-party speakers, nor is FXCM responsible for the content, veracity or opinions of third-party speakers, presenters or participants.

XAGUSD 1H forecastProjection of further buys on #SILVER We have an impulse pattern formation. Waves 1 and 5 are typically equal with that idea, we can anticipate the price to continue moving to the upside and break the current minor range.

26.03.25 Morning ForecastPairs on Watch -
OANDA:XAGUSD
FX:EURUSD
FX:NZDUSD
A short overview of the instruments I am looking at for today, multi-timeframe analysis down to what I will be looking at for an entry. Enjoy!

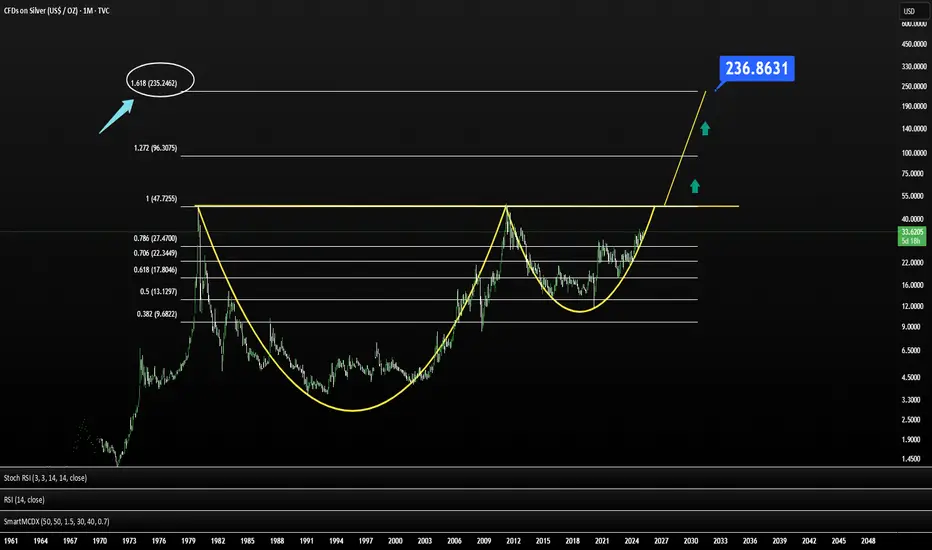
SILVER IS UNDERVALUED - A trade of a decade!Silver is undervalued! The pattern is over 50 years old and on a massive timeframe.
Silver and gold are always a good add to a strong portfolio. Currently it's in the progress of completing the handle of the cup and handle. 48$ will be a big resistance, but after that it will gap up over years to it's 1.618 as target. This wil take a give or take 10 years.
XAG/USD Trade Ideas: Navigating Key Resistance and Support ZonesSilver 's Next Move: Technical and Fundamental Insights for XAGUSD Traders 🚀📊
Technical Analysis 📊
The chart provided is a 4-hour chart of Silver (XAG/USD) with Fibonacci retracement levels applied. Here's a detailed technical breakdown:
Trend Analysis 📈:
The price has recently rebounded from a low near $32.90 and is now trading at $33.66.
The short-term trend appears bullish, as the price has made a higher low and is attempting to break higher.
Fibonacci Retracement Levels 🔢:
The Fibonacci retracement levels are drawn from the recent swing high to swing low.
The price has retraced to the 50% Fibonacci level ($33.35) and is now testing the 0% retracement level ($33.80), which acts as resistance.
The 61.8% retracement level ($33.24) and 78.6% retracement level ($33.09) are key support zones if the price pulls back.
Resistance and Support 🛑🛠️:
Resistance: The immediate resistance is at $33.80 (0% Fibonacci level). A break above this level could open the door to further upside, targeting $34.25 (50% Fibonacci extension).
Support: The first support is at $33.35 (50% Fibonacci level), followed by $33.24 (61.8% Fibonacci level).
Candlestick Patterns 🕯️:
The recent candles show indecision near the resistance level, indicating a potential pause or reversal.
If a strong bullish candle forms above $33.80, it would confirm a breakout.
Momentum 🚀:
The price is showing bullish momentum, but the resistance at $33.80 needs to be cleared for further upside.
Fundamental Analysis 🌍
Silver's Role as a Safe Haven 🛡️:
Silver often acts as a hedge against inflation and economic uncertainty. If there are concerns about global economic stability or inflationary pressures, silver demand could increase.
US Dollar Impact 💵:
Silver is inversely correlated with the US Dollar. If the USD weakens due to dovish Federal Reserve policies or poor economic data, silver prices could rise.
Industrial Demand ⚙️:
Silver has significant industrial applications, particularly in electronics and renewable energy. Any positive developments in these sectors could support silver prices.
Upcoming Economic Events 📅:
The chart shows upcoming economic events (likely US-related). If these events lead to USD weakness or increased market uncertainty, silver could benefit.
Trade Idea 💡
Scenario 1: Bullish Breakout 🚀
Entry: Buy above $33.80 (on a confirmed breakout).
Target: $34.25 (50% Fibonacci extension) and $34.50 (psychological level).
Stop Loss: Below $33.35 (50% Fibonacci level).
Scenario 2: Pullback and Rebound 🔄
Entry: Buy near $33.35 (50% Fibonacci level) or $33.24 (61.8% Fibonacci level) if the price pulls back.
Target: $33.80 (0% Fibonacci level) and $34.25.
Stop Loss: Below $33.00.
Scenario 3: Bearish Reversal 📉
Entry: Sell below $33.24 (61.8% Fibonacci level) if the price fails to hold support.
Target: $33.00 and $32.90.
Stop Loss: Above $33.50.
Conclusion ✅
The current setup favors a bullish bias 📈, but the resistance at $33.80 is critical. A breakout above this level could lead to significant upside, while a failure to break higher may result in a pullback to key support levels. Monitor price action closely around the Fibonacci levels and upcoming economic events for confirmation. ⚠️
Disclaimer ⚠️
This analysis is for informational purposes only and should not be considered financial advice. Trading involves significant risk, and you should only trade with capital you can afford to lose. Always conduct your own research or consult with a licensed financial advisor before making any trading decisions.

XAG USD LONG Silver price after falling from the ascending channel last week took a straight dump in a closing descending channel and seemed to take support from the purple minor zone from which I took the long trade which is still running.
Also formed a double bottom and broke out the diagonal Trendline resistance indicating more bullish Signs.

Silver’s Bullish Breakout Raises Stakes for $34.24 RetestSilver delivered a monster bullish candle on Tuesday, completing a morning star pattern while smashing through wedge resistance that had capped gains earlier in the week. With RSI (14) setting higher lows and MACD on the verge of a bullish crossover, price and momentum signals suggest a growing risk of a retest of the March 18 high at $34.24.
Silver has a habit of gravitating toward round figures, making any pullback toward $33.50 a potential buying opportunity where longs could be established above with a stop beneath for protection. Resistance may emerge near $34, though $34.24 appears a more meaningful initial target. A break above that could encourage bulls to chase a move toward the October high of $34.87.
If silver reverses back beneath former wedge resistance and holds there, the bullish bias would be invalidated.
Good luck!
DS

SILVER - Breaking GoodWhile gold cycles are a bit cconfusing, the silver cycle is crystal clear.
Silver printed an ICL last year December .The intermediate cycle's first daily cycle is behind us . The DCL was printed on 28th February.
Right now we are in the 2nd daily cycle . This is the daily cycle where silver can break 35$ and finish this intermediate cycle at 40-42$ during the following weeks.
Gold printed a strong rally in the past weeks, but the xauxag ratio is turning down and there is a good chance the lower part of the consolidation box will be tagged during the following weeks.
If you are in a gold long position probably it's time to switch to a silver long position...
If you don't have any precious metal position it's time to open a silver long position.

silver|foxforexSilver received support from the lower support of the ascending channel by making a double bottom. The target is 35,000 according to both Fibonacci and channel trend.

silver bullishThe silver chart I shared before is working very well. The flag formation has now been broken. The price will reach the 35 level again in the coming months.

Silver H1 | Falling to swing-low supportSilver (XAG/USD) is falling towards a swing-low support and could potentially bounce off this level to climb higher.
Buy entry is at 32.85 which is a swing-low support.
Stop loss is at 32.54 which is a level that lies underneath an overlap support and the 61.8% Fibonacci retracement.
Take profit is at 33.56 which is a swing-high resistance that aligns close to the 61.8% Fibonacci retracement.
High Risk Investment Warning
Trading Forex/CFDs on margin carries a high level of risk and may not be suitable for all investors. Leverage can work against you.
Stratos Markets Limited (www.fxcm.com):
CFDs are complex instruments and come with a high risk of losing money rapidly due to leverage. 63% of retail investor accounts lose money when trading CFDs with this provider. You should consider whether you understand how CFDs work and whether you can afford to take the high risk of losing your money.
Stratos Europe Ltd (www.fxcm.com):
CFDs are complex instruments and come with a high risk of losing money rapidly due to leverage. 63% of retail investor accounts lose money when trading CFDs with this provider. You should consider whether you understand how CFDs work and whether you can afford to take the high risk of losing your money.
Stratos Trading Pty. Limited (www.fxcm.com):
Trading FX/CFDs carries significant risks. FXCM AU (AFSL 309763), please read the Financial Services Guide, Product Disclosure Statement, Target Market Determination and Terms of Business at www.fxcm.com
Stratos Global LLC (www.fxcm.com):
Losses can exceed deposits.
Please be advised that the information presented on TradingView is provided to FXCM (‘Company’, ‘we’) by a third-party provider (‘TFA Global Pte Ltd’). Please be reminded that you are solely responsible for the trading decisions on your account. There is a very high degree of risk involved in trading. Any information and/or content is intended entirely for research, educational and informational purposes only and does not constitute investment or consultation advice or investment strategy. The information is not tailored to the investment needs of any specific person and therefore does not involve a consideration of any of the investment objectives, financial situation or needs of any viewer that may receive it. Kindly also note that past performance is not a reliable indicator of future results. Actual results may differ materially from those anticipated in forward-looking or past performance statements. We assume no liability as to the accuracy or completeness of any of the information and/or content provided herein and the Company cannot be held responsible for any omission, mistake nor for any loss or damage including without limitation to any loss of profit which may arise from reliance on any information supplied by TFA Global Pte Ltd.
The speaker(s) is neither an employee, agent nor representative of FXCM and is therefore acting independently. The opinions given are their own, constitute general market commentary, and do not constitute the opinion or advice of FXCM or any form of personal or investment advice. FXCM neither endorses nor guarantees offerings of third-party speakers, nor is FXCM responsible for the content, veracity or opinions of third-party speakers, presenters or participants.

Silver (XAG/USD) Double Top Reversal – Bearish Trading SetupThe provided 1-hour chart for Silver (XAG/USD) presents a well-structured bearish trade setup, highlighting key price action patterns, technical indicators, and confluence factors that suggest a potential downside move. Let's analyze the chart step by step to understand the logic behind this bearish trade setup.
1. Market Structure & Trend Overview
Silver (XAG/USD) has been in a short-term uptrend, as indicated by the ascending trendline. However, the trend now shows signs of exhaustion, with a clear shift in market behavior. The price action reveals the formation of a double top at a strong resistance level, coupled with a Change of Character (CHOCH), which signals a possible reversal.
A break below the trendline suggests that the bullish momentum is losing strength, and sellers are beginning to dominate the market. The combination of these elements makes this setup a high-probability short trade opportunity.
2. Key Technical Levels & Zones
A. Resistance Zone ($33.96 - $34.20) – The Selling Pressure Area
The chart marks a clear resistance zone, where price has struggled to break higher.
Two price rejections from this level indicate that sellers are actively defending this region.
This zone serves as an ideal stop-loss area for short trades, as a breakout above this level would invalidate the bearish setup.
B. Double Top Formation – Reversal Pattern
The price tested the resistance zone twice and failed to establish new highs, forming a double top structure.
A double top is a well-known bearish reversal pattern, indicating a shift from bullish to bearish momentum.
The second top (Top 2) aligns with a downward trendline, further confirming that sellers are stepping in at lower levels.
C. Support Level ($32.60 - $32.80) – Initial Reaction Zone
This area has previously acted as a demand zone where buyers stepped in.
If the price breaks below this support, it would confirm further downside movement towards the final target.
D. Trendline Breakdown – Loss of Bullish Momentum
The dotted trendline represents the previous bullish trend, supporting price action for several days.
A break below this trendline suggests a structural shift in market dynamics, meaning buyers are losing control.
The failure to reclaim the trendline increases the probability of a deeper move downward.
E. Target Level ($32.11 - $32.20) – The Bearish Objective
The projected target is based on the double top’s measured move, which suggests a price drop to at least $32.11.
This level also coincides with previous historical price action, making it a strong confluence zone for profit-taking.
3. Trading Strategy & Execution Plan
📌 Entry Point:
Aggressive Entry: Short position around $33.40 - $33.50, near the second top where price rejected the trendline.
Conservative Entry: Wait for a confirmed break and retest of the support level at $32.80 before entering short.
📌 Stop-Loss Placement:
The stop-loss should be placed above the resistance zone at $33.96.
This level ensures that the trade is invalidated if the price breaks out higher.
📌 Take-Profit Target:
Primary Target: $32.60, which is the first support level where price may temporarily react.
Final Target: $32.11, aligning with the double top breakdown target and historical support.
📌 Risk-Reward Ratio:
A minimum 1:2 risk-reward ratio, meaning for every 1% risked, there is a potential 2%+ gain.
This makes the trade favorable in terms of risk management.
4. Confluence Factors Supporting the Bearish Outlook
✅ Double Top Formation – A classic bearish reversal pattern.
✅ Lower Highs Formation – Indicates increasing selling pressure.
✅ Trendline Breakdown – A significant loss of bullish momentum.
✅ Resistance Zone Rejection – Strong seller presence.
✅ CHOCH (Change of Character) – Confirms a shift in market sentiment.
5. Risk Management & Alternative Scenario
📌 What If Price Moves Against the Trade?
If the price breaks above $33.96, the bearish outlook becomes invalid, and a potential bullish continuation could follow. In this case:
Stop-loss is triggered, and the setup is considered invalid.
Traders should then wait for a new setup before re-entering the market.
📌 Market Conditions to Monitor:
Volatility: Ensure there is enough momentum in the market before entering.
Volume Confirmation: A break below support should have strong volume.
News Events: Watch out for fundamental catalysts, such as US Dollar strength, economic data, and geopolitical events, which could influence Silver’s price movement.
6. Final Thoughts & Summary
This chart setup provides a clear bearish trade opportunity based on technical analysis. The combination of double top formation, resistance rejection, trendline breakdown, and lower highs strongly supports the idea of further downside movement.
💡 Key Takeaways:
Bearish bias is valid as long as price stays below $33.96.
Target is set at $32.11, with an intermediate support at $32.60.
Risk-to-reward is favorable, making it an ideal short trade setup.
If the market follows this expected scenario, this trade has the potential to yield significant profit while maintaining disciplined risk management. However, always stay alert to market conditions and adjust strategies accordingly.

Tariff Fears Drive Silver to $33.10Silver rose above $33.10 per ounce on Tuesday, snapping a four-day losing streak. The market focused on U.S. diplomatic efforts in the Russia-Ukraine conflict and escalating violence in the Middle East after an Israeli airstrike on a Gaza hospital.
A weaker U.S. dollar also supported silver, with concerns growing that Trump’s proposed tariffs could slow economic growth, fueling speculation of further Fed rate cuts. Meanwhile, investors assessed China’s outlook after Premier Li Qiang urged global cooperation to stabilize economic conditions.
If silver breaks above $33.75, the next resistance levels are $34.05 and $34.85. On the downside, support is at $33.10, with further levels at $32.50 and $32.15 if selling pressure increases.

SILVER SHORT FROM RESISTANCE
SILVER SIGNAL
Trade Direction: short
Entry Level: 3,314.3
Target Level: 3,276.5
Stop Loss: 3,339.5
RISK PROFILE
Risk level: medium
Suggested risk: 1%
Timeframe: 1h
Disclosure: I am part of Trade Nation's Influencer program and receive a monthly fee for using their TradingView charts in my analysis.
✅LIKE AND COMMENT MY IDEAS✅

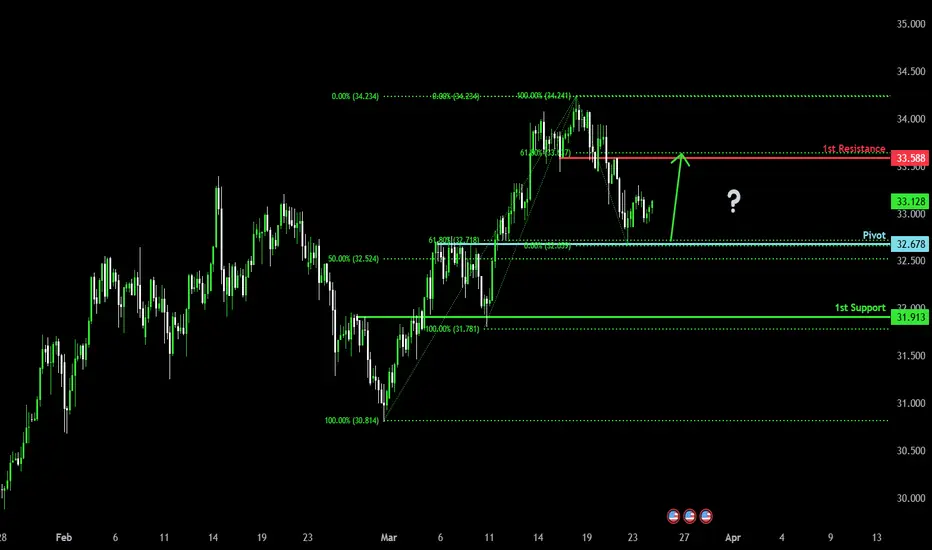
Potential bullish rise?The Silver (XAG/USD) has bounced off the pivot and could rise to the 1st resistance which aligns with the 61.8% Fibonacci retracement.
Pivot: 32.67
1st Support: 31.91
1st Resistance: 33.58
Risk Warning:
Trading Forex and CFDs carries a high level of risk to your capital and you should only trade with money you can afford to lose. Trading Forex and CFDs may not be suitable for all investors, so please ensure that you fully understand the risks involved and seek independent advice if necessary.
Disclaimer:
The above opinions given constitute general market commentary, and do not constitute the opinion or advice of IC Markets or any form of personal or investment advice.
Any opinions, news, research, analyses, prices, other information, or links to third-party sites contained on this website are provided on an "as-is" basis, are intended only to be informative, is not an advice nor a recommendation, nor research, or a record of our trading prices, or an offer of, or solicitation for a transaction in any financial instrument and thus should not be treated as such. The information provided does not involve any specific investment objectives, financial situation and needs of any specific person who may receive it. Please be aware, that past performance is not a reliable indicator of future performance and/or results. Past Performance or Forward-looking scenarios based upon the reasonable beliefs of the third-party provider are not a guarantee of future performance. Actual results may differ materially from those anticipated in forward-looking or past performance statements. IC Markets makes no representation or warranty and assumes no liability as to the accuracy or completeness of the information provided, nor any loss arising from any investment based on a recommendation, forecast or any information supplied by any third-party.
Silver wants to increase more & moreI’m keeping an eye on silver, there’s a good chance it could climb back to the $40. In my opinion, silver usually trails gold by a step or two, but it tends to follow the same overall trend. On the 3-month chart, the RSI is around 66, which is a known resistance level. If it breaks through soon, we might see a strong upward move.

XAGUSD - longthis is a market structure trade . simple is better . never complicate to much! use risk managment !
