XAG/USD (Silver) – 1H Technical Analysis & Trade SetupThis analysis presents a high-probability bullish trade setup based on key price action principles, market structure, and technical indicators. The chart illustrates a potential reversal from a support zone, a descending channel breakout, and an overall shift in trend dynamics.
1. Market Structure & Key Price Levels
Before placing any trade, it's essential to analyze the bigger picture, including support and resistance levels, trend structure, and liquidity zones. Let's break down the key areas:
A. Resistance Area (Supply Zone) – $34.20 to $34.60
This horizontal resistance zone has historically acted as a selling pressure area where price faced rejection.
It represents a profit-taking zone for bulls and a possible reversal point for bears.
If price successfully breaks and closes above this resistance, it could signal further upside potential.
B. Support Level (Demand Zone) – $32.90 to $33.10
The price has consistently bounced from this region, indicating strong buying interest.
This level has acted as a demand zone, where institutions or large traders are likely accumulating positions.
A strong bullish reaction from this zone strengthens the reversal scenario.
C. Change of Character (CHoCH) – Key Structural Shift
A Change of Character (CHoCH) is marked on the chart, indicating a potential shift from a bearish to a bullish trend.
This is one of the most reliable signals when transitioning from a downtrend to an uptrend.
2. Chart Pattern & Price Action Analysis
A. Descending Channel Formation (Bullish Reversal Pattern)
The market has been forming a descending channel, which is a corrective pattern rather than a continuation pattern.
This structure consists of lower highs and lower lows, indicating short-term selling pressure.
However, when such a pattern forms near strong support, it often precedes a breakout and trend reversal.
A confirmed break above the channel's upper trendline will serve as a bullish breakout signal.
B. Liquidity Grab & Stop Hunt Consideration
Many retail traders place stop-loss orders below the support zone, making it an area of liquidity accumulation.
The market may attempt to sweep these stops before moving up, which aligns with institutional trading behavior.
If price momentarily dips below the support and then quickly reverses with strong bullish momentum, it confirms a stop hunt and a possible reversal setup.
3. Trading Strategy & Setup
To maximize profits while managing risk, we need a well-structured entry, target, and stop-loss strategy.
📌 Entry Strategy
Aggressive Entry:
Enter a buy position within the support zone ($33.00 - $33.10) if bullish price action (e.g., bullish engulfing candle) confirms buying pressure.
Conservative Entry:
Wait for a clear breakout from the descending channel’s upper trendline, then buy on a retest.
This reduces the risk of a fakeout and provides higher confirmation.
🎯 Target Levels (Take Profit Zones)
First Target (TP1) – $34.26
This is a key resistance level where price previously reversed.
Partial profit-taking is recommended here to secure gains.
Second Target (TP2) – $34.60
If momentum continues, price could reach this extended target.
Strong breakout volume would support this move.
🛑 Stop Loss (SL) Placement
Stop-loss should be set below the support zone ($32.45).
This ensures adequate risk management and avoids premature stop-outs.
If price breaks below this level with strong selling volume, the bullish setup is invalidated.
4. Risk Management & Trade Considerations
📌 Risk-to-Reward Ratio (RRR):
The trade setup offers an RRR of at least 1:3, making it a high-probability trade.
📌 Possible Fakeouts & Confirmation Signals:
If price breaks above the descending channel but fails to hold above support, it's a sign of a fake breakout.
Watch for strong bullish volume and clear break of previous lower highs before entering long.
📌 Fundamental Factors:
Keep an eye on economic reports, Federal Reserve speeches, and USD strength, as they heavily influence Silver prices.
5. Conclusion – High-Probability Bullish Setup
Descending channel breakout, strong support level, and CHoCH indicate a potential bullish reversal.
If buyers successfully defend the support zone, price is likely to target $34.26 – $34.60.
Risk management is crucial – waiting for confirmation reduces chances of a failed trade.
🚀 Watch for bullish confirmation before entering!
SILVERCFD trade ideas

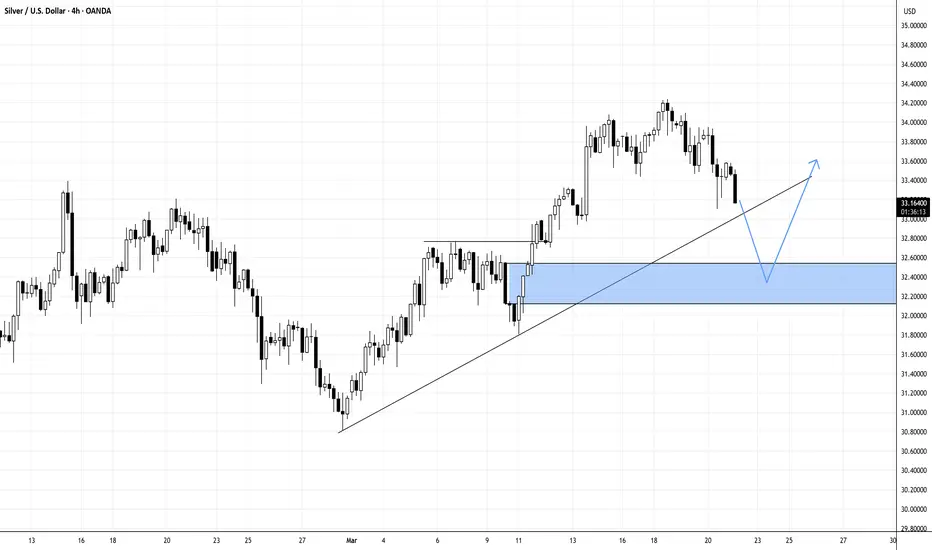
Why is Gold hitting record highs while Silver lags behind?Silver 21-Mar-2025:
Many investors are wondering why Gold continues to reach new highs, while Silver remains below its 2011 all-time high of around $49.50.
It’s important to understand that Silver is not perceived as a safe-haven asset to the same extent as Gold. During times of uncertainty, capital tends to flow more aggressively into Gold as a hedge. While Silver may benefit from this momentum, its heavy use in industrial production makes a sharp rally less favorable for manufacturers—much like we see in oil markets.
As of now, Silver is trading around $33.
From a technical perspective, some traders are observing the following levels:
* A potential short-term move above $35 may open the way for a retest of the $37 area.
* Support was previously seen near $32.5.
* A sustained move below $32.5 might lead to a deeper correction, possibly toward the $30.8 support zone.
* If the $30 psychological level fails to hold, further downside toward $29 cannot be ruled out.
Disclaimer: easyMarkets Account on TradingView allows you to combine easyMarkets industry leading conditions, regulated trading and tight fixed spreads with TradingView's powerful social network for traders, advanced charting and analytics. Access no slippage on limit orders, tight fixed spreads, negative balance protection, no hidden fees or commission, and seamless integration.
Any opinions, news, research, analyses, prices, other information, or links to third-party sites contained on this website are provided on an "as-is" basis, are intended only to be informative, is not an advice nor a recommendation, nor research, or a record of our trading prices, or an offer of, or solicitation for a transaction in any financial instrument and thus should not be treated as such. The information provided does not involve any specific investment objectives, financial situation and needs of any specific person who may receive it. Please be aware, that past performance is not a reliable indicator of future performance and/or results. Past Performance or Forward-looking scenarios based upon the reasonable beliefs of the third-party provider are not a guarantee of future performance. Actual results may differ materially from those anticipated in forward-looking or past performance statements. easyMarkets makes no representation or warranty and assumes no liability as to the accuracy or completeness of the information provided, nor any loss arising from any investment based on a recommendation, forecast or any information supplied by any third-party.

XAG/USD LONG XAG/USD LONG "break of a resistance area and retest it + 50% fib retracement + trendline "
if the 33.00000 didn t hold we might see a deeper pullback to 32.60000 area as the 200ema can play as dynamic support + support area

Silver Steadies Near $33.20 After PullbackSilver hovered near $33.20 on Friday morning after two consecutive sessions of decline. The recent upward momentum, initially fueled by China’s stimulus measures, has temporarily stalled. Nevertheless, the potential for further gains remains intact amid persistent uncertainty surrounding former President Trump’s tariff policies and escalating geopolitical risks. In addition, the Federal Reserve’s soft approach to interest rates, even if temporary, continues to support interest in non-yielding assets like silver.
If silver breaks above $33.75, the next resistance levels are $34.05 and $34.85. On the downside, support is at $33.10, with further levels at $32.50 and $32.15 if selling pressure increases.

Silver Approaching Critical 32.95 Support LevelSilver has broken below the 33.50 support and is retreating quickly. The main support lies around the 32.95 area, where both the uptrend line and the 38.2% Fibonacci retracement level converge. This zone could potentially offer a buying opportunity, provided the support holds.
However, if Silver breaks below 32.95 and retests it from underneath, it could also present a selling opportunity. In both scenarios, a high risk/reward trade setup with well-placed stops may form.
Caution is advised, as Silver is known for sudden price spikes, especially around key support and resistance levels.

Let's get some Supply and DemandNow, this is example about Silver.
I think Silver can be applied Supply and Demand method.
The wave can up side down.

SilverXAGUSD
Completed " 12345 " Impulsive Waves and " A " Corrective Waves at Fibonacci Level - 38.20%. It has breakout the Structure , it can reverse to complete its retracement , Order Block and " B " Corrective Wave

WILL SILVER DIP BELOW 32.6 BEFORE ITS RALLY TO TEST RECENT HIGH?Silver Price Movement...
N.B!
- XAGUSD price might not follow the drawn lines . Actual price movements may likely differ from the forecast.
- Let emotions and sentiments work for you
- ALWAYS Use Proper Risk Management In Your Trades
#silver
#xagusd
Elliott Wave View: Silver (XAGUSD) Pullback Remains SupportedShort Term Elliott Wave view in Silver (XAGUSD) suggests rally from 2.28.2025 low is in progress as a 5 waves impulse. Up from 2.28.2025 low, wave ((i)) ended at 32.76 and pullback in wave ((ii)) ended at 31.79 as a zigzag structure. Down from wave ((i)), wave (a) ended at 32.08 and wave (b) ended at 32.66. Wave (c) lower ended at 31.79 which completed wave ((ii)). Up from there, wave ((iii)) higher unfolded as a 5 waves impulse in lesser degree.
Up from wave ((ii)), wave (i) ended at 33.31 and dips in wave (ii) ended at 32.92. Wave (iii) higher ended at 34.08 and pullback in wave (iv) ended at 33.41. The final leg wave (v) ended at 34.23 which completed wave ((iii)) in higher degree. Pullback in wave ((iv)) is proposed complete with internal subdivision as a zigzag. Down from wave ((iii)), wave (a) ended at 33.43 and wave (b) ended at 33.94. Wave (c) lower ended at 33.07 which completed wave ((iv)). Near term, as far as pivot at 31.79 low stays intact, expect pullback to find support in 3, 7, or 11 swing for further upside.


SILVER HI GUYS silver has two entry sell possibilities the high risk price action point and low risk great return break and retest point

SILVER SELLSHI GUYS I expect silver to sell in the next 3 to 4hours.
at the break and retest second sell entry

SILVER LONG SIGNAL|
✅SILVER has retested a key
Support level of 33.39$
After a bearish correction
While trading in an uptrend
So we can enter a long trade
With the Take Profit of 33.89$
And the Stop Loss of 33.08$
LONG🚀
✅Like and subscribe to never miss a new idea!✅
Disclosure: I am part of Trade Nation's Influencer program and receive a monthly fee for using their TradingView charts in my analysis.

SILVER (#XAGUSD): Bearish Reversal ConfirmedSilver formed a classic head and shoulders pattern on the 4-hour chart.
Following the release of US fundamentals today, the price quickly dropped significant and broke below the pattern's neckline.
The price currently retesting the broken neckline, suggesting a potential continuation of the bearish reversal.
The next support levels to watch for are at 33.05.

XAGUSD | 19.03.2025SELL 33.9000 | STOP 34.3000 | TAKE 33.3200 | We expect the price to move down from the local ascending channel near the medium-term maximums to the nearest support level in the area of 33.3200-33.0500.

Silver is in the bullish trendHello Traders
In This Chart XAGUSD HOURLY Forex Forecast By FOREX PLANET
today XAGUSD analysis 👆
🟢This Chart includes_ (XAGUSD market update)
🟢What is The Next Opportunity on XAGUSD Market
🟢how to Enter to the Valid Entry With Assurance Profit
This CHART is For Trader's that Want to Improve Their Technical Analysis Skills and Their Trading By Understanding How To Analyze The Market Using Multiple Timeframes and Understanding The Bigger Picture on the Charts

Silver (XAG/USD) – Rising Wedge Breakdown & Bearish OutlookChart Overview
This is a 1-hour chart of Silver (XAG/USD) from OANDA, showing recent price action forming a rising wedge pattern followed by a bearish breakdown. The price initially rallied within the wedge but failed to sustain gains above the key resistance zone, leading to a strong rejection and downward momentum.
Key Chart Elements & Analysis
1. Rising Wedge Formation (Bearish Pattern)
The market was in an uptrend, forming higher highs and higher lows within a rising wedge pattern.
A rising wedge is a classic bearish reversal pattern, which indicates weakening buying pressure as price consolidates upward.
The price eventually broke below the lower trendline, signaling a shift in momentum from bullish to bearish.
2. Resistance Zone & Rejection
A strong resistance zone was identified around $33.80 - $34.20 USD (highlighted in blue).
Price attempted multiple times to break above this level but faced selling pressure, leading to a sharp reversal.
The final breakout attempt failed, confirming that sellers are in control.
3. Breakdown & Retest of Support
After breaking down from the wedge, the price found temporary support around $33.20 USD, which aligns with a previous consolidation area.
A retest of the broken wedge support turned into resistance, further confirming the bearish bias.
The rejection from this level strengthened the case for a move lower.
4. Next Support Level & Target Projection
The next significant support zone is around $31.95 - $32.00 USD (marked as the "Target" area).
This level coincides with previous price action support, making it a high-probability bearish target.
The breakdown is expected to follow a measured move projection, bringing price toward this level.
Trade Plan & Execution Strategy
📉 Bearish Setup (Short Opportunity)
Ideal Entry: A pullback to the previous support (now resistance) at $33.20 - $33.40 USD could offer an entry for shorts.
Stop-Loss: Above $33.80 USD, just above the resistance zone.
Target Levels:
Primary Target: $32.50 USD
Final Target: $31.95 - $32.00 USD
Confirmation: Look for price rejection or bearish candlestick formations at resistance before entering.
⚠️ Risk Management & Considerations
Bullish Scenario: If price reclaims $33.80 USD, the bearish setup could be invalidated, and a move higher toward $34.50 USD is possible.
Market Conditions: Keep an eye on macroeconomic factors, news events, and USD strength, as they can influence silver prices.
Conclusion: Bearish Outlook with Downside Target 🎯
The rising wedge breakdown signals further downside potential.
A support retest rejection confirms selling pressure.
$31.95 - $32.00 USD remains the main target, aligning with technical projections.
Short positions with proper risk management remain favorable in this setup.

SILVER HEADING UPSilver is in a bullish trend and the price showed us some bearish movement by creating a Solid low but that was later rejected by buyers which took over the trend again thus breaking above the Higher high and retracing back to it, meaning price is likely to continue its bullish movement after some liquidity grab on the "Higher high" area

SILVER Is Very Bullish! Buy!
Here is our detailed technical review for SILVER.
Time Frame: 12h
Current Trend: Bullish
Sentiment: Oversold (based on 7-period RSI)
Forecast: Bullish
The market is approaching a significant support area 3,339.6.
The underlined horizontal cluster clearly indicates a highly probable bullish movement with target 3,470.7 level.
P.S
The term oversold refers to a condition where an asset has traded lower in price and has the potential for a price bounce.
Overbought refers to market scenarios where the instrument is traded considerably higher than its fair value. Overvaluation is caused by market sentiments when there is positive news.
Disclosure: I am part of Trade Nation's Influencer program and receive a monthly fee for using their TradingView charts in my analysis.
Like and subscribe and comment my ideas if you enjoy them!

silver sellshi guys
i expect the market to follow this chart pattern as we sell to daily take profit

Silver on the Brink: Will Buyers Step In?Silver is retracing alongside gold and other assets, but is this a buying opportunity? Key support levels to watch: $32.14, aligning with silver’s sensitivity to gold, and $31.50, the lower range of the current channel. Fundamentals remain strong, with trade wars and geopolitical tensions supporting long-term bullish momentum. Where do you see silver heading next? Share your thoughts below!
This content is not directed to residents of the EU or UK. Any opinions, news, research, analyses, prices or other information contained on this website is provided as general market commentary and does not constitute investment advice. ThinkMarkets will not accept liability for any loss or damage including, without limitation, to any loss of profit which may arise directly or indirectly from use of or reliance on such information

pullback trade The price has rejected the Fibonacci area multiple time and has made a lower low, now it looks to go bearish
WE ONLY TRADE PULLBACKS

Silver Holds Near $33.60 as Fed Signals 2025 Rate CutsSilver hovered near $33.60 after the Fed held rates at 4.25%-4.5%, signaling 50 bps cuts by 2025. Despite trade-war fears and Trump’s policies, silver remains near a five-month high.
Lease rates surged as stockpiles shrank, especially in London, with silver flowing to the US for higher prices, widening market price gaps. Spot silver is up 17% this year, outperforming other commodities.
Tariffs strain silver transfers from Canada and Mexico, tightening supply and fueling fears of a prolonged “silver squeeze.”
If silver breaks above $34.05, the next resistance levels are $34.85 and $35.00. On the downside, support is at $33.80, with further levels at $33.15 and $32.75 if selling pressure increases.