Bullish continuation?XAG/USD is falling towards the support level which is an overlap support and could bounce from this level to our take profit.
Entry: 33.02
Why we like it:
There is an overlap support level.
Stop loss: 32.21
Why we like it:
There is a pullback support level that is slightly below the 23.6% Fibonacci retracement.
Take profit: 34.51
Why we like it:
There is a pullback resistance level.
Enjoying your TradingView experience? Review us!
Please be advised that the information presented on TradingView is provided to Vantage (‘Vantage Global Limited’, ‘we’) by a third-party provider (‘Everest Fortune Group’). Please be reminded that you are solely responsible for the trading decisions on your account. There is a very high degree of risk involved in trading. Any information and/or content is intended entirely for research, educational and informational purposes only and does not constitute investment or consultation advice or investment strategy. The information is not tailored to the investment needs of any specific person and therefore does not involve a consideration of any of the investment objectives, financial situation or needs of any viewer that may receive it. Kindly also note that past performance is not a reliable indicator of future results. Actual results may differ materially from those anticipated in forward-looking or past performance statements. We assume no liability as to the accuracy or completeness of any of the information and/or content provided herein and the Company cannot be held responsible for any omission, mistake nor for any loss or damage including without limitation to any loss of profit which may arise from reliance on any information supplied by Everest Fortune Group.
SILVERCFD trade ideas

SHORT ON SILVER XAG/USDSilver is currently at a major level of supply and is currently respecting it.
it has swept liquidity and is also over brought on the RSI.
I will be selling silver to the previous swing low / demand zone.

SILVER - Late But Harder Time to load up for the long term. Gold's going crazy right now while silver's still sleeping. This discount ain't gonna last.
SILVER (XAGUSD): Pullback is Ahead!
There is a high chance that Silver will pull back from
the underlined blue daily resistance.
As a confirmation, the price formed a double top pattern
on that on an hourly chart and violated its neckline.
Goal - 33.185
❤️Please, support my work with like, thank you!❤️

SILVER HI GUYS silver is also awesome all moves were accurate u can either wait for daily demand pattern and a second confirmation on RSI div for incoming legit sells. sometimes u have to be patient and wait for the right moment esp if u are an investor

Dead cat bounce todayGold/silver ratio was clearly over extended. The next opportunity is at 28 support and/or when the data showing the recession is here as Silver is an industrial metal first

XAG/USD For Bullishwait for pull-back near by entry point and then go long
general trend is up trend
have fun :)

Silver Update – April Rollercoaster Ends in Bullish Setup?What a month it has been for Silver also!
In early April, the metal broke down from a rising wedge pattern, triggering a waterfall drop of around 6,000 pips. The plunge took us right into the 28 zone, but the reversal that followed was nothing short of spectacular.
In just two trading days, Silver rocketed back above the key 30 level, and the rally didn’t stop there. By mid-month, it reclaimed the 32 support – a level previously broken during the drop.
📉 Last week, however, price action turned quiet compared to the volatility in Gold, with Silver entering a tight consolidation.
But here’s the key point:
➡️ Despite the sharp early-month drop, the structure is now bullish again and remains so as long as 32 holds.
💡 Trading Plan:
I'm looking to buy dips near 32 in anticipation of a breakout above 33.15 – the upper boundary of the recent consolidation.
If that level gives way, Silver could accelerate its gains and make a new attempt toward 35.
Disclosure: I am part of Trade Nation's Influencer program and receive a monthly fee for using their TradingView charts in my analyses and educational articles.

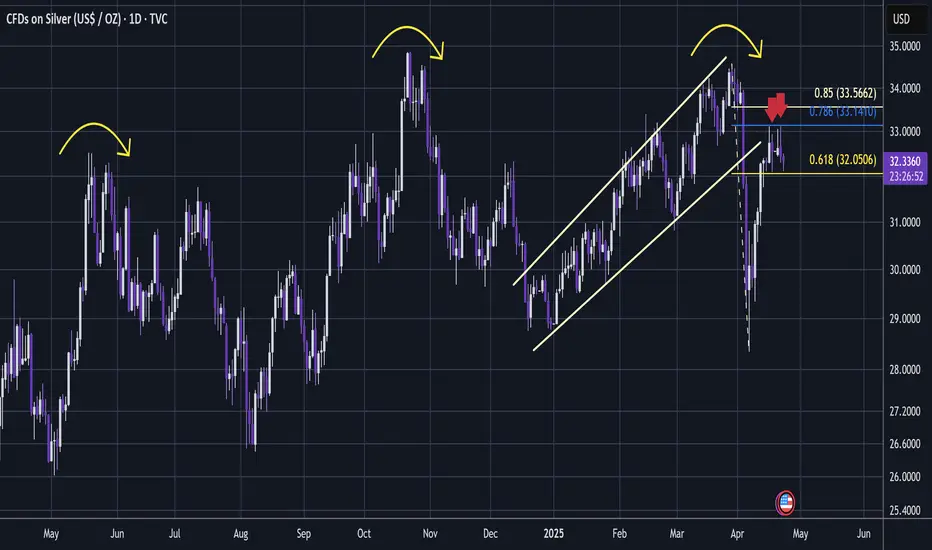
SILVER - High Time Frame Downtrend Is UnderwaySILVER
Had a huge bounce with all the Trump tariff kerfuffle and that was quite off-putting.
But it looks to be revealing its hand now; printing a Golden Window failure (0.618-0.786 retracement rejection) with little upper wicks (red arrows) signalling a significant point of resistance.
The GW failure follows a fairly limp ascending channel that would appear to have bearish cause.
And the whole high time frame area appears to be a Head & Shoulders reversal pattern.
Silver appears to be waiting for the cue from Gold turning bearish to finally fall into a significant high time frame downtrend.
I entered a short here.
Invalidation would be a move above 0.85 ratio 👍.
Not advice
SILVER WILL FALL|SHORT|
✅SILVER has retested a key
Resistance level of 33.15$
And as the pair is already
Making a bearish pullback
A move down to retest the
Demand level below
At 32.09$ is likely
SHORT🔥
✅Like and subscribe to never miss a new idea!✅
Disclosure: I am part of Trade Nation's Influencer program and receive a monthly fee for using their TradingView charts in my analysis.

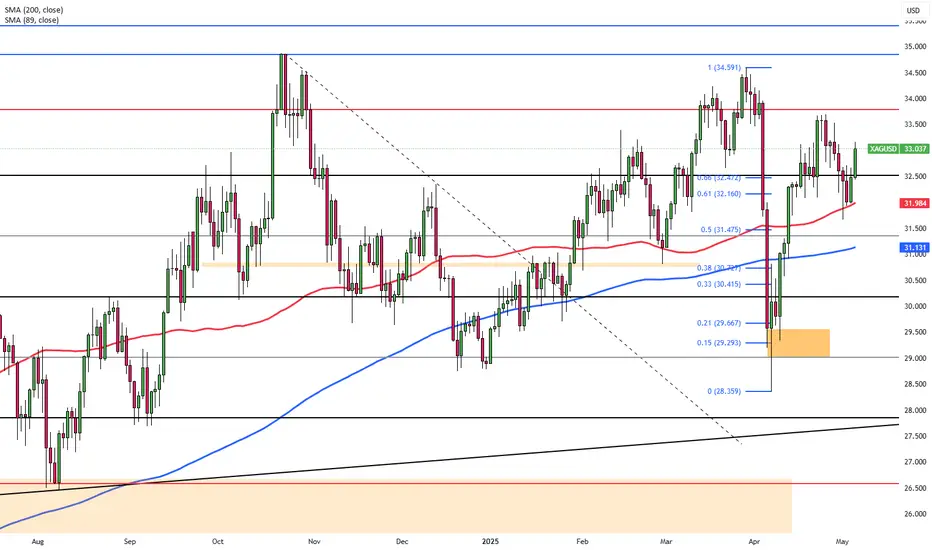
Silver (XAG/USD) Bullish Breakout Toward $34.40 Target Key Observations:
Support Zone (Around $32.00 - $32.50):
Price has respected this zone multiple times (green arrows indicate successful bullish reactions).
EMA 50 and 200 are aligned beneath current price, acting as dynamic support (bullish signal).
Resistance / Target 1 (~$33.40 area):
Price is approaching this area again, previously acting as a resistance.
Short-term traders might consider this a partial take-profit zone.
Target 2 (~$34.40 area):
If the resistance/Target 1 zone is broken and confirmed (as the black arrow suggests), the price could rally toward Target 2.
There's room for bullish continuation based on prior momentum and structure.
📈 Technical Outlook:
Trend: Bullish (higher lows, EMA crossover)
Bias: Bullish continuation if price breaks and retests the $33.40 zone.
Risk: Rejection at resistance could push price back toward the $32.00–$32.50 support.

XAG/USD For Bullishwait for pull-back near by entry point and then go long
general trend is up trend
General rule: buy at the bottom
have fun :)

SILVER BEST PLACE TO SELL FROM|SHORT
SILVER SIGNAL
Trade Direction: short
Entry Level: 3,305.2
Target Level: 3,164.4
Stop Loss: 3,398.5
RISK PROFILE
Risk level: medium
Suggested risk: 1%
Timeframe: 12h
Disclosure: I am part of Trade Nation's Influencer program and receive a monthly fee for using their TradingView charts in my analysis.
✅LIKE AND COMMENT MY IDEAS✅

XAG/USD Stable Ahead of Fed DecisionSilver (XAG/USD) held steady on Tuesday, underpinned by safe-haven demand as U.S. tariff tensions and global growth concerns persisted. Although the U.S. dollar saw a slight recovery, silver maintained its ground with markets focused on the upcoming Federal Reserve policy decision. Expectations for unchanged rates and possible future easing could continue to lend support to silver in the near term.
The first resistance is seen at $33.80, with higher levels at $34.20 and $34.85 if momentum builds. Support begins at $32.00, followed by $31.40 and $30.20.
SILVER - Bullish idea - 1hr TFSilver seems to be ready for a bullish rally
As per COT report, Short positions are decreasing, Net positions are decreasing as of 29-APR-2025
SL and TP defined, can be bought instantly.
TP are all resistance zones
SLs are all support area from CMP
Manage your risk reward accordingly.
Happy Trading!

Silver sellAfter the price breaks the uptrend line and moving averages and closes below the volume zone, we will enter a sell now.

XAG/USD 30_Min Chart- Bearish Flag in Formation Pattern: Bearish Flag
Target: 32.000
Trade Bias: Bearish Setup
Technical Breakdown:
The chart shows a strong impulsive sell-off, followed by a channel-like upward retracement, forming a bearish flag structure.
Price has now reached a resistance zone around 33.400, marked by previous rejection.
This area aligns with the upper boundary of the flag, and price is starting to weaken — signaling potential reversal.
Bearish Flag Logic:
A bearish flag is a pause in a downtrend, typically resolving with a continuation move downward.
If the lower trendline of the flag breaks, it would confirm the pattern and signal further downside pressure.
Trade Setup Details:
Entry Zone: Below 33.000 (breakout candle close)
Target: 32.000 (based on flagpole measured move)
Stop-Loss: Above resistance ~33.500


Silver pleasurable ATMMany people are happy with their silver positions... What will make them sell it??
A loss of 50% into 2027 with a fake capitulation bottom.. Pump and dump??
They would be able to stock up on all the silver needed for smart cities and military weapons.
I like silver and we need it. BUT they need it manipulated to a cheap price and the military industry gets what it wants.
BE SAFE, NOT FINANCIAL ADVICE!!!

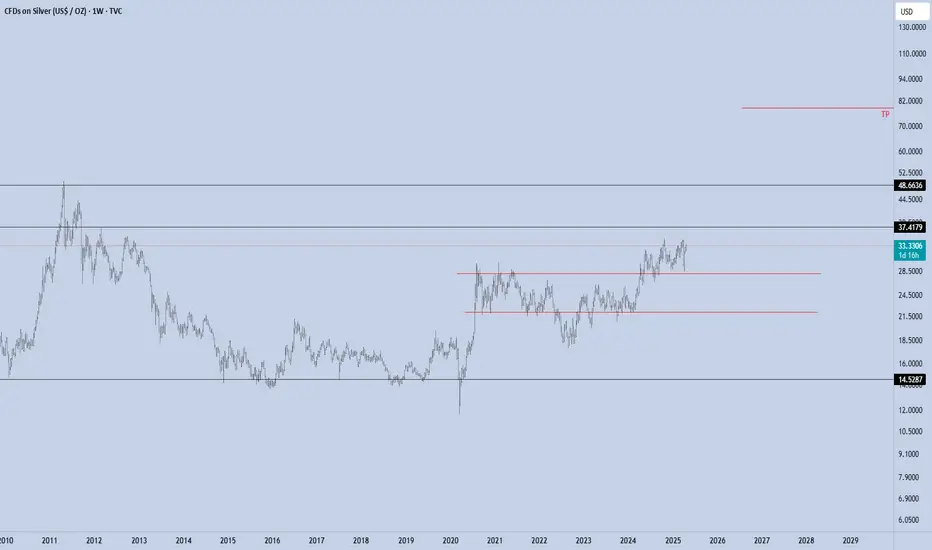
XAGUSD Double Top Pattern – Bearish Reversal Targeting $22 Zone"
🔎 Key Zones and Annotations Explained
🟥 Resistance Level (Supply Zone):
Marked in red, this level represents a historical supply area where sellers consistently outweigh buyers.
Multiple rejections from this zone confirm its strength.
🔄 RS Interchange (Support-Turned-Resistance):
This area around 26.00 – 27.50 has previously acted as support and could now act as resistance if price attempts to retrace upward after breaking down.
📉 Bearish Projection Path:
A potential price trajectory is illustrated with a zigzagging downward pattern, reflecting corrective moves and retests.
If the neckline is breached convincingly, this projection suggests continued bearish follow-through toward the 22.00 region.
🎯 Trade Setup and Risk Plan
Entry Trigger:
Short position considered after confirmation of neckline break (~29.50), ideally on a weekly candle close below this level or a successful bearish retest of broken support.
Stop Loss Placement:
Above the resistance highs at 35.57, which would invalidate the double top and signal possible trend continuation.
Profit Target:
Based on the measured move of the double top (height from resistance to neckline), we target the 22.42 – 22.46 region.
This aligns with previous support and a psychological round level, making it a strong candidate for price reaction.
⚠️ Risk Management Considerations
Always use defined position sizing and risk-reward ratios. A minimum of 1:2 RR is recommended.
Confirm breakdowns with volume spikes, momentum divergence, or break of trendlines for added confluence.
Keep an eye on macroeconomic data (like inflation rates, Fed interest rate decisions, and USD index strength) which can heavily impact the value of precious metals like Silver.
📘 Educational Insight: Why Double Tops Work
The double top is a psychological failure pattern. The first top attracts buyers expecting a breakout, but when price returns to that level and fails again, it often triggers mass liquidation and new short entries, especially when the neckline support fails. This builds downward momentum, making it a favorite pattern among swing and position traders.
🏁 Conclusion
This weekly chart of XAGUSD paints a clear picture: Silver may have topped out in the short-to-mid term. If the double top confirms and neckline breaks, expect a sizable correction back into the lower $20s. The risk is clearly defined, and the reward potential is high. Patience and confirmation are key.
💬 What Do You Think?
Do you agree with this bearish outlook on Silver? Are you waiting for confirmation before entering? Drop your thoughts or analysis below!
📌 T ags/Hashtags
#XAGUSD #Silver #DoubleTop #TechnicalAnalysis #ChartPatterns #SwingTrading #Commodities #PriceAction #Forex #BearishSetup #Metals #TradingView #GoldAndSilver #ShortTradeSetup

Silver : After an excellent recovery, succumb to a Red band.Silver : After an excellent recovery from the support of $ 28.33 , it seems it has succumbed to a Red Band resistance of $34.
It's in a Sell trajectory already and couldn't become a Buy, like Gold .
Support is at $28 and Resistance is at $34 as displayed on the chart .
( Not a Buy / Sell Recommendation
Do your own due diligence ,Market is subject to risks, This is my own view and for learning only .)

SILVER: Will Start Growing! Here is Why:
Remember that we can not, and should not impose our will on the market but rather listen to its whims and make profit by following it. And thus shall be done today on the SILVER pair which is likely to be pushed down by the bears so we will sell!
Disclosure: I am part of Trade Nation's Influencer program and receive a monthly fee for using their TradingView charts in my analysis.
❤️ Please, support our work with like & comment! ❤️

Silver Slips on Trade Optimism and Weak Economic Data Silver prices dropped over 1% on Thursday, slipping to around $32 per ounce, dragged by reduced safe-haven demand following Trump's optimistic remarks on potential trade deals with China, India, Japan, and South Korea.
Weak economic data further pressured prices, with the U.S. economy contracting by 0.3% and China’s manufacturing PMI falling to a 16-month low, raising concerns about industrial demand.
Today, silver is showing signs of recovery amid improved risk appetite, with the market focus on the $34.90–$35.00 resistance zone as a key technical level.
Narrow Range: $31.30 – $33.70
Wide Range: $28.50 – $34.90/35.00
