Evening Star canddle Bearish SignHello,
Evening Star patterns appear at the top of the uptrend and signal that the uptrend is going to reverse to a downtrend
Disclaimer:
The above opinions given constitute general market commentary, and do not constitute the opinion or advice of IC Markets or any form of personal or investment advice.
SILVERCFD trade ideas

SILVER Bullish Bias! Buy!
Hello,Traders!
SILVER is trading in a local
Uptrend and the price is
Consolidating above the
The horizontal support
Level of 29.89$ so we are
Locally bullish biased
And we will be expecting
A further bullish move up
Buy!
Comment and subscribe to help us grow!
Check out other forecasts below too!

XAGUSD Head and Shoulders pattern.www.tradingview.com
Formed a Head and Shoulder pattern.
We expect that the price will go down for a short period of time.
Plan your Entry and Exit. OANDA:XAGAUD

XAGUSD Long Swing PositionEntry: 29.690
SL: 28.738
Take Profit 1: 31.903
Take Profit 2: 33.222
Take Profit 3: 34.860

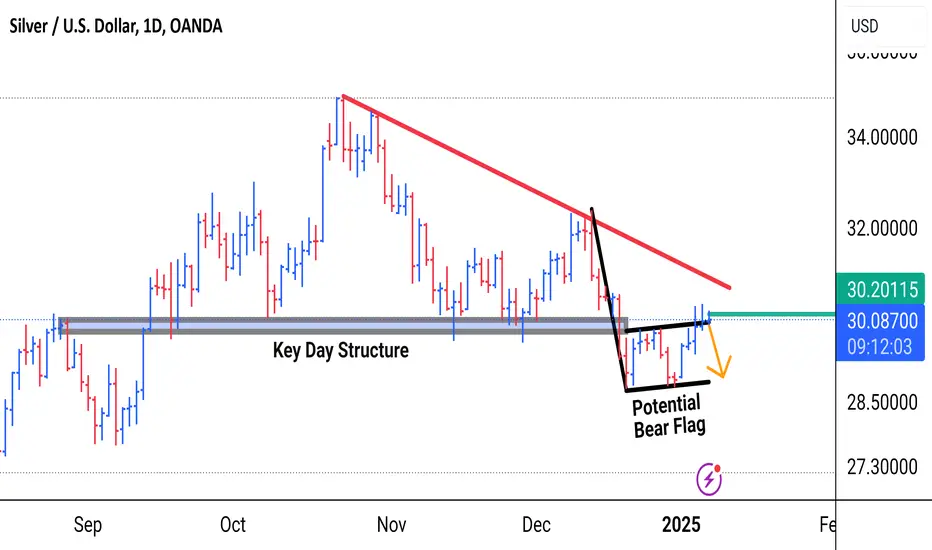
Potential Sell-off in Silver.Silver is at the upper end of a potential daily bear flag.
It has been attempting to retest a horizontal structure. We can also see from the red trend line it is currently in a downwards trend.
So long as we don't close above yesterday's high. The path of least resistance is lower.
Silver trend line breaks and it will be bearish (read caption)Hello dear traders and trading view usera I have prepared setup for silver and I want your reviews about it in comment section.
My setup is what is written below read and then share your thoughts about it.
This is a 1-hour price chart for XAG/USD Silver
Trend Line Break : A red ascending trendline is drawn, and the yellow highlight indicates a breakout above this trendline.
Target After Breakout : Following the breakout, the price target is suggested below at approximately $30.00, indicating a potential retracement or price movement downward.
This chart I have made suggests that a breakout has occurred, which you might interpret as a signal for a change in trend.
Kindly support me.

SILVER (XAGUSD): Consolidation is Over! Silver experienced a sudden increase earlier this week, breaking through a resistance line within a horizontal consolidation range on a 4-hour chart.
This could indicate the possibility of continued growth, with the next resistance level to watch being at 31.00.

XAG USD LONG RESULTSilver Price has been in a downtrend for days previously and noticed a Swing pattern few days ago forming a double Bottom pattern. Which I decided to go long after successful breakout of Trendline to this Major Resistance level.
Silver is still in an Uptrend, it's just in a minor consolidation before Bulls Continue.

Silver H4 | Approaching overlap resistanceSilver (XAG/USD) is rising towards an overlap resistance and could potentially reverse off this level to drop lower.
Sell entry is at 30.67 which is an overlap resistance that aligns close to the 50.0% Fibonacci retracement level.
Stop loss is at 31.10 which is a level that sits above the 61.8% Fibonacci retracement and a pullback resistance.
Take profit is at 29.79 which is an overlap support.
High Risk Investment Warning
Trading Forex/CFDs on margin carries a high level of risk and may not be suitable for all investors. Leverage can work against you.
Stratos Markets Limited (www.fxcm.com):
CFDs are complex instruments and come with a high risk of losing money rapidly due to leverage. 64% of retail investor accounts lose money when trading CFDs with this provider. You should consider whether you understand how CFDs work and whether you can afford to take the high risk of losing your money.
Stratos Europe Ltd (www.fxcm.com):
CFDs are complex instruments and come with a high risk of losing money rapidly due to leverage. 66% of retail investor accounts lose money when trading CFDs with this provider. You should consider whether you understand how CFDs work and whether you can afford to take the high risk of losing your money.
Stratos Trading Pty. Limited (www.fxcm.com):
Trading FX/CFDs carries significant risks. FXCM AU (AFSL 309763), please read the Financial Services Guide, Product Disclosure Statement, Target Market Determination and Terms of Business at www.fxcm.com
Stratos Global LLC (www.fxcm.com):
Losses can exceed deposits.
Please be advised that the information presented on TradingView is provided to FXCM (‘Company’, ‘we’) by a third-party provider (‘TFA Global Pte Ltd’). Please be reminded that you are solely responsible for the trading decisions on your account. There is a very high degree of risk involved in trading. Any information and/or content is intended entirely for research, educational and informational purposes only and does not constitute investment or consultation advice or investment strategy. The information is not tailored to the investment needs of any specific person and therefore does not involve a consideration of any of the investment objectives, financial situation or needs of any viewer that may receive it. Kindly also note that past performance is not a reliable indicator of future results. Actual results may differ materially from those anticipated in forward-looking or past performance statements. We assume no liability as to the accuracy or completeness of any of the information and/or content provided herein and the Company cannot be held responsible for any omission, mistake nor for any loss or damage including without limitation to any loss of profit which may arise from reliance on any information supplied by TFA Global Pte Ltd.
The speaker(s) is neither an employee, agent nor representative of FXCM and is therefore acting independently. The opinions given are their own, constitute general market commentary, and do not constitute the opinion or advice of FXCM or any form of personal or investment advice. FXCM neither endorses nor guarantees offerings of third-party speakers, nor is FXCM responsible for the content, veracity or opinions of third-party speakers, presenters or participants.

$SILVERTimeframe: D
The correction has almost reached our local target. Next, I expect the growth to continue and the global high of 50.00 to be updated.
#SILVER #Trading #Investing #StockMarket #Stocks

Bearish drop?XAG/USD is reacting off the resistance level which is a pullback resistance and could drop from this level to our take profit.
Entry: 30.16
Why we like it:
There is a pullback resistance level.
Stop loss: 30.68
Why we like it:
There is an overlap resistance level that is slightly above the 50% Fibonacci retracement.
Take profit: 29.53
Why we like it:
There is an overlap support level that lines up with the 50% Fibonacci retracement.
Enjoying your TradingView experience? Review us!
Please be advised that the information presented on TradingView is provided to Vantage (‘Vantage Global Limited’, ‘we’) by a third-party provider (‘Everest Fortune Group’). Please be reminded that you are solely responsible for the trading decisions on your account. There is a very high degree of risk involved in trading. Any information and/or content is intended entirely for research, educational and informational purposes only and does not constitute investment or consultation advice or investment strategy. The information is not tailored to the investment needs of any specific person and therefore does not involve a consideration of any of the investment objectives, financial situation or needs of any viewer that may receive it. Kindly also note that past performance is not a reliable indicator of future results. Actual results may differ materially from those anticipated in forward-looking or past performance statements. We assume no liability as to the accuracy or completeness of any of the information and/or content provided herein and the Company cannot be held responsible for any omission, mistake nor for any loss or damage including without limitation to any loss of profit which may arise from reliance on any information supplied by Everest Fortune Group.

SILVERSILVER price reached 30.28 by Newyork session before 4hr correction, AM bullish on silver and it could out perform GOLD soon

Silver is gaining momentumSilver is gaining momentum! A bullish falling wedge dating back to Oct '24 is approaching a breakout—$31 is the key level to watch. 📈 With a bullish MACD cross on the chart, a breakout might not be far off. #Silver #Markets

SILVER POTENTIAL BOUNCE PLAY BUY OPPORTUNITYHey everyone hope you are having an amazing day! I just wanted to come make another post here on this Thanksgiving week here in the States and give some insight to what I see for the commodity Silver! Hope this brings some value and you guys can pull some nuggets from this! Cheers
OK so here is a breakdown based on each timeframe for what I am seeing!!
1W (Weekly) Timeframe:
**price is overall bullish
**price is coming back to a previous area of demand (buyers)
**weekly fib retracement confluence with level
1D (Daily) Timeframe:
**price is coming to previous demand around $29 per ounce
**will be at a extreme discount zone (relevant to current market trend)
**may be in oversold conditions on the RSI tool
4H (Hourly) Timeframe:
**waiting to watch how price momentum from sellers is coming into zone
**waiting for lower timeframe confluence
Hope you guys enjoy this post please boost and follow the page for more analysis and potential setups! Cheers!

Silver analysis Silver Strong Supply area's
This is not financial advice trade and manage your own risk

XAGUSD Scenario 1.1.2025At this moment the market may create an SFP below the low, which could lead to consideration of entering a short, but for now, waiting.
