Monday bounce points to extension of bullish move
Silver bounced off minor support at $31.84 in early Asian trade on Monday, indicating the level may be useful for traders eyeing a potential bullish setup.
Longs could be established above the level with a tight stop beneath to protect against reversal. Overhead, former uptrend support currently intersects with the key 50-day moving average around $32.50, making that a potential initial target. A break above would bring $32.73 into play, a level that acted as both support and resistance during March.
The momentum picture has become more palatable for bulls, with RSI (14) trending higher and back near neutral. MACD remains in negative territory and is yet to cross the signal, though it’s starting to curl higher, suggesting bearish momentum is ebbing.
If silver reverses and breaks $31.84, the setup would be invalidated, opening the door to trades targeting a partial retracement of the recent bounce.
Good luck!
DS
SILVERCFD trade ideas

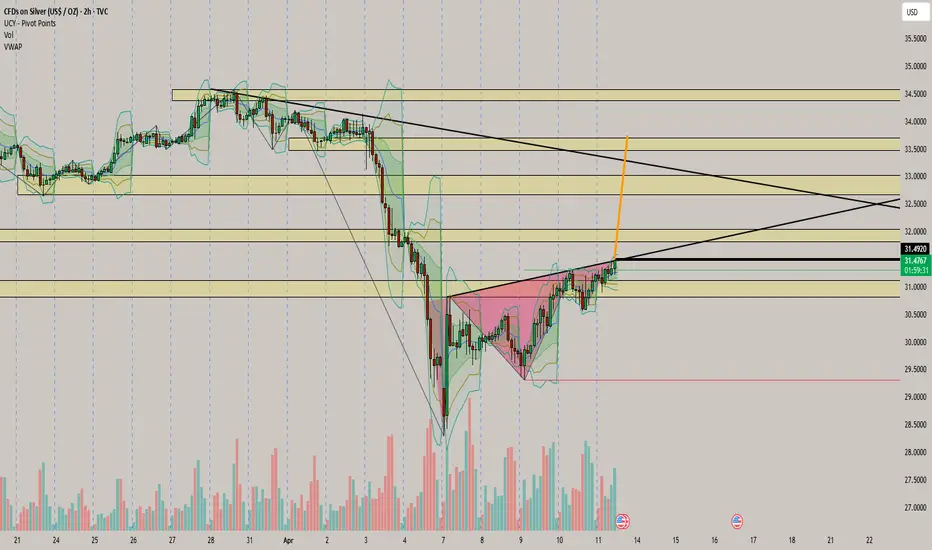
Bearish reversal off overlap resistance?XAG/USD is rising towards the resistance level which is an overlap resistance that lines up with the 71% Fibonacci retracement and could reverse from this level to our take profit.
Entry: 32.71
Why we like it:
There is an overlap resistance level that lines up with the 71% Fibonacci retracement.
Stop loss: 33.59
Why we like it:
There is a pullback resistance level.
Take profit: 31.47
Why we like it:
There is a pullback support level that lines up with the 23.6% Fibonacci retracement.
Enjoying your TradingView experience? Review us!
Please be advised that the information presented on TradingView is provided to Vantage (‘Vantage Global Limited’, ‘we’) by a third-party provider (‘Everest Fortune Group’). Please be reminded that you are solely responsible for the trading decisions on your account. There is a very high degree of risk involved in trading. Any information and/or content is intended entirely for research, educational and informational purposes only and does not constitute investment or consultation advice or investment strategy. The information is not tailored to the investment needs of any specific person and therefore does not involve a consideration of any of the investment objectives, financial situation or needs of any viewer that may receive it. Kindly also note that past performance is not a reliable indicator of future results. Actual results may differ materially from those anticipated in forward-looking or past performance statements. We assume no liability as to the accuracy or completeness of any of the information and/or content provided herein and the Company cannot be held responsible for any omission, mistake nor for any loss or damage including without limitation to any loss of profit which may arise from reliance on any information supplied by Everest Fortune Group.

Bearish reversal?The Silver (XAG/USD) is rising towards the pivot and could reverse to the 1st support which acts as an overlap support.
Pivot: 32.82
1st Support: 30.90
1st Resistance: 34.56
Risk Warning:
Trading Forex and CFDs carries a high level of risk to your capital and you should only trade with money you can afford to lose. Trading Forex and CFDs may not be suitable for all investors, so please ensure that you fully understand the risks involved and seek independent advice if necessary.
Disclaimer:
The above opinions given constitute general market commentary, and do not constitute the opinion or advice of IC Markets or any form of personal or investment advice.
Any opinions, news, research, analyses, prices, other information, or links to third-party sites contained on this website are provided on an "as-is" basis, are intended only to be informative, is not an advice nor a recommendation, nor research, or a record of our trading prices, or an offer of, or solicitation for a transaction in any financial instrument and thus should not be treated as such. The information provided does not involve any specific investment objectives, financial situation and needs of any specific person who may receive it. Please be aware, that past performance is not a reliable indicator of future performance and/or results. Past Performance or Forward-looking scenarios based upon the reasonable beliefs of the third-party provider are not a guarantee of future performance. Actual results may differ materially from those anticipated in forward-looking or past performance statements. IC Markets makes no representation or warranty and assumes no liability as to the accuracy or completeness of the information provided, nor any loss arising from any investment based on a recommendation, forecast or any information supplied by any third-party.

SILVER SHORT FROM STRONG RESISTANCE|
✅SILVER is going up now
Following the market-wide
Bullish rebound on most assets
But a strong wide resistance
Level is ahead around 33.00$
Thus I am expecting a pullback
And a move down towards
The local target of 31.75$
SHORT🔥
✅Like and subscribe to never miss a new idea!✅
Disclosure: I am part of Trade Nation's Influencer program and receive a monthly fee for using their TradingView charts in my analysis.

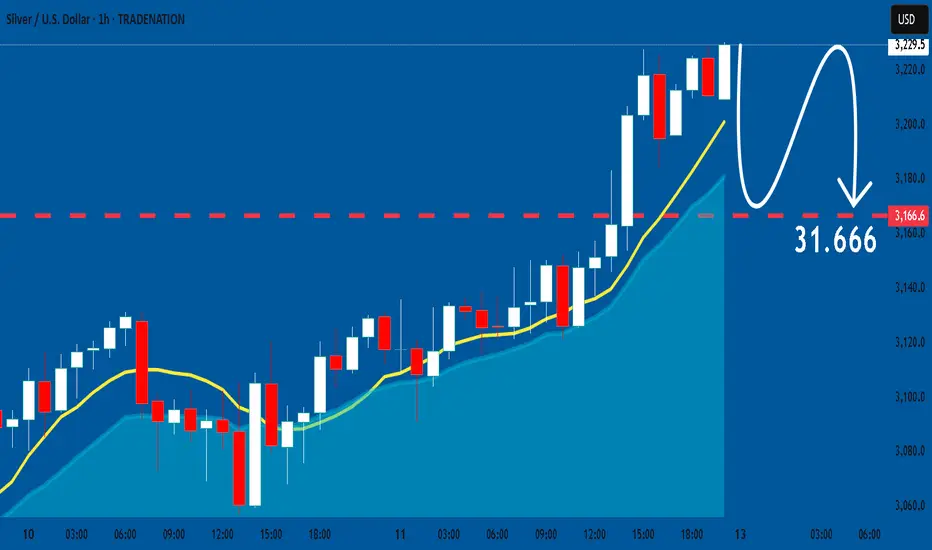
SILVER: Bearish Forecast & Bearish Scenario
It is essential that we apply multitimeframe technical analysis and there is no better example of why that is the case than the current SILVER chart which, if analyzed properly, clearly points in the downward direction.
Disclosure: I am part of Trade Nation's Influencer program and receive a monthly fee for using their TradingView charts in my analysis.
❤️ Please, support our work with like & comment! ❤️
XAGUSD - Awaiting Correction Before Next Leg HigherSilver (XAG/USD) appears to be in a recovery phase after experiencing a sharp selloff in early April that found a bottom near $2,840. The 4-hour chart shows the price has rebounded significantly from those lows and we are expecting for it to form a correction pattern. Based on the projected price path, we can expect a period of consolidation with some downside movement to establish a higher low, potentially targeting the $3,060-3,080 support zone, before resuming the larger uptrend toward $3,350 and beyond. This anticipated correction provides an excellent opportunity for traders to prepare long setups at discounted prices, with the highlighted support area around $2,880 serving as a major floor that should contain any deeper pullbacks. The overall technical structure suggests this retracement will be temporary before bulls regain control of the market.
Disclosure: I am part of Trade Nation's Influencer program and receive a monthly fee for using their TradingView charts in my analysis.

Silver Massive C&H Bull Market 400%+ gains Lifetime opportunity🏆 Silver Market Update (April 13th, 2025)
📊 Technical Outlook Update
▪️Long-term outlook 2weeks/candle
▪️Massive C&H formation in progress
▪️40 USD breakout pending now
▪️PT BULLS 400%+ gains BUY/HOLD
▪️Price Target BULLS 125/150 USD
▪️Bull market still pending
▪️BUY/HOLD now or miss out on gains
📢 Silver Market Update – April 2025
📈Silver is widely used in electronics due to its exceptional electrical and thermal conductivity, making it ideal for various applications, including printed circuit boards, connectors, and contact surfaces.
🚀 It is also employed in devices like touch screens, batteries, and solar panels. Silver's high conductivity, solderability, and resistance to corrosion and oxidation contribute to its popularity in the electronics industry.

XAG/USD Daily AnalysisStrong buying came into play at the $29 supply/support zone which we last saw tested and rejected twice back in December 2024.
After a brief pause at $31 on Thursday, buyers took price to a high of the week at $32.27
It's possible that we might see a pullback and correction, testing $31 which was support in February this year.
This is just an idea of what may happen. You should always trade with a well tested and profitable trading strategy using good risk management.

SILVER Massive Long! BUY!
My dear friends,
Please, find my technical outlook for SILVER below:
The price is coiling around a solid key level - 29.588
Bias -Bullish
Technical Indicators: Pivot Points Low anticipates a potential price reversal.
Super trend shows a clear buy, giving a perfect indicators' convergence.
Goal - 31.319
Safe Stop Loss - 28.754
About Used Indicators:
The pivot point itself is simply the average of the high, low and closing prices from the previous trading day.
Disclosure: I am part of Trade Nation's Influencer program and receive a monthly fee for using their TradingView charts in my analysis.
———————————
WISH YOU ALL LUCK

Silver is KingSilver just broke out the sale, it will over take the Gold in this rally, and target 3 digit prices.

XAG/USD For Bullishwait for pull-back near by entry point and then go long
general trend is up trend
have fun :)

Silver continues to riseThere’s a high probability we’ll see higher levels.
In trading, you don’t operate with certainties, but with probabilities—and right now, silver has a high probability of continuing its upward move.
It’s also returning, much like gold, to levels seen before the announcement of trade tariffs.
Additionally, it has broken above the 30.80 level—a very strong level that previously acted as both support and resistance.
As long as the price stays above it, I believe we can talk about long setups.

SILVER: The Market Is Looking Down! Short!
My dear friends,
Today we will analyse SILVER together☺️
The recent price action suggests a shift in mid-term momentum. A break below the current local range around 31.806 will confirm the new direction downwards with the target being the next key level of 31.490.and a reconvened placement of a stop-loss beyond the range.
❤️Sending you lots of Love and Hugs❤️

Silver in Q1 2025: Technical and Fundamental BreakdownIntroduction
Silver has emerged as a standout among precious metals in Q1 2025, delivering solid gains amid choppy markets. While gold grabs headlines with its record highs, silver quietly notched a 17% rise since January, showcasing its dual role as an industrial staple and a safe-haven for traders. In this article, we dive into silver’s price action, the impact of tariffs, recession risks, and supply-demand dynamics to uncover trading opportunities.
Silver’s Price Action in Q1
Silver closed 2024 at $28.94 per ounce (December 30) but kicked off 2025 with a strong rebound. Starting at $29.53 (January 2), it cleared the $30 mark by January 7 and ended the month at $31.28. February kept the momentum alive, hitting a high of $32.94 (February 20) before settling at $31.13. March pushed further, breaking $32 on March 5 and reaching a quarterly peak of $34.43 on March 27. However, April brought a pullback: prices dipped to $33.67 on April 1 and briefly fell below $30 after U.S. tariff announcements on April 2.
Technical Analysis
• Support and Resistance Levels: Support has formed around $29.50, with resistance near $34.50. The $30 level has toggled between support and resistance, acting as a key pivot.
• Moving Averages: Prices remain above the 50-day and 200-day moving averages, signaling a bullish trend.
• RSI: The daily Relative Strength Index (RSI) sits at 65, suggesting room for upside before hitting overbought territory.
Tariffs: Volatility as a Trading Edge
Since early 2025, U.S. tariff policies have fueled market uncertainty. The announcement of a 10% global tariff, alongside targeted duties on April 2, drove traders toward safe-haven assets like silver.
• Market Impact: Tariffs could dampen industrial demand (e.g., in solar panels and EVs), but silver’s safe-haven appeal may offset this pressure.
• Trading Idea: Volatility creates setups for short-term trades. Breakouts or range-bound strategies using options can capitalize on current conditions.
Recession Risks: A Dual Impact
The looming threat of a U.S. recession continues to shape market sentiment. The Atlanta Fed’s GDPNow forecast of -2.8% for Q1 2025, ahead of official data on April 30, has heightened concerns.
• Historical Context: During recessions, silver’s performance varies. Industrial slowdowns can curb demand, but capital flows into safe assets often bolster prices.
• Current Outlook: If recession fears intensify, silver could draw attention as a gold alternative. However, a confirmed downturn risks hitting industrial sectors, so keep an eye on macro releases.
Supply and Demand: Deficit as a Bullish Driver
The Silver Institute’s March 3 report flagged a fifth consecutive year of supply shortages, tightening the market.
• Industrial Demand: Solar panels (232 million ounces annually) and electric vehicles (80 million ounces) remain major consumers. Watch for updates from these sectors, as production shifts could sway prices.
• Supply Constraints: Reports of physical silver moving from UK vaults to New York, possibly in anticipation of tariffs, hint at a potential crunch within six months.
Outlook: Short-Term and Long-Term Views
A near-term consolidation or pullback is possible after Q1’s strong rally. The $29-$30 zone looks like a solid buying opportunity, especially if prices find support at the 50-day moving average.
• Technical Setup: A break above $34.50 could target $37-$38. RSI suggests the rally has legs.
• Trading Strategy: Consider buying dips to $30 with a stop below $28, aiming for $35. Alternatively, enter on a breakout above $34.50 for higher targets.
• Long-Term Trend: Supply deficits and silver’s role in green energy support a bullish case. Still, macro factors like interest rates and the dollar call for adaptability.
Conclusion
In 2025, silver remains a focal point for traders, driven by a mix of technical strength and fundamental catalysts. Tariffs, recession risks, and supply dynamics create a complex but opportunity-rich environment. Leverage technical analysis and stay tuned to newsflow to navigate volatility and tap into silver’s long-term potential.

SILVER rising trendline support retest Silver maintains a bullish sentiment, in line with the prevailing uptrend. Recent intraday price action suggests a corrective pullback, potentially retesting the previous consolidation zone for support.
Key Level: 3090
This zone represents a significant area of prior consolidation and now acts as a key support level.
Bullish Scenario:
A pullback toward 3090 followed by a bullish bounce would confirm continued upside momentum. Immediate resistance targets include 3266, with extended upside potential toward 3350 and 3450 over the longer term.
Bearish Alternative:
A confirmed breakdown and daily close below 3090 would negate the current bullish outlook. This would open the door for a deeper retracement toward 3028, followed by 2945.
Conclusion:
Silver remains technically bullish while trading above 3090. A successful retest and rebound from this level would support further upside. However, a daily close below 3090 would shift sentiment bearish in the short term, increasing the risk of a deeper correction.
This communication is for informational purposes only and should not be viewed as any form of recommendation as to a particular course of action or as investment advice. It is not intended as an offer or solicitation for the purchase or sale of any financial instrument or as an official confirmation of any transaction. Opinions, estimates and assumptions expressed herein are made as of the date of this communication and are subject to change without notice. This communication has been prepared based upon information, including market prices, data and other information, believed to be reliable; however, Trade Nation does not warrant its completeness or accuracy. All market prices and market data contained in or attached to this communication are indicative and subject to change without notice.

SILVER (XAGUSD): More Growth is Coming
Following Gold, Silver formed a strong bullish pattern on an hourly time frame.
I found the ascending triangle formation and a breakout of its neckline
as a strong bullish confirmation.
I expect growth at least to 31.7 level now.
❤️Please, support my work with like, thank you!❤️
I am part of Trade Nation's Influencer program and receive a monthly fee for using their TradingView charts in my analysis.

XAG/USD Climbs on FOMC WorriesSilver prices climbed above $31 per ounce on Thursday, extending gains for a second straight session as commodities rebounded following President Trump’s rollback of his reciprocal tariff policy. The new measure lowers tariffs on most trade partners to 10% for 90 days to support negotiations. However, China, a key silver consumer, still faces a steep 125% tariff, keeping geopolitical tensions elevated and sustaining safe-haven demand. Meanwhile, FOMC minutes revealed growing concerns about stagflation and the impact of Trump’s trade agenda on the Fed’s dual mandate of price stability and full employment.
Resistance starts at 31.50; if breached, the next levels are 32.15 and 33.30. Support sits at 30.20, with 29.50 and 29.20 below if that level gives way.

Silver at a Crossroads: More Pain or a Rally Above 34?Silver is undergoing a potential trend change. The previous yellow uptrend channel has been broken, and a new, nearly flat-slightly downward channel (marked by blue lines) appears to be forming. While it may be too early to confirm this as an established trend, the structure is developing with increasing clarity.
Silver is now at a crossroads. The former trendline is being retested, and just above it lies a confluence of resistance: a previous demand zone and the 200-day moving average. These former support levels have now merged into a strong resistance area.
Unless this resistance zone is broken, downward pressure is likely to persist. However, a breakout could open the door for a medium-term move toward the 34 level.
Please check gold/silver chart for longer term understanding:

XAGUSD: Silver, and the latest on tariffs!Silver is trading in its ascending channel on the 4-hour timeframe, between the EMA200 and EMA50. If silver reaches the supply zone, it can be sold. A downward correction will also provide us with a buying opportunity with a good risk-reward ratio.
U.S. President Donald Trump has implemented tariff policies with the aim of revitalizing domestic manufacturing. During the 1980s, a significant portion of American manufacturing jobs either moved overseas or were replaced by automation technologies.
The shift in production was largely driven by wage disparities across countries. Nevertheless, the United States remains a leading global manufacturer, although it now focuses on producing higher-value goods. Experts argue that imposing import taxes is unlikely to achieve one of its stated goals: restoring manufacturing as a central pillar of the U.S. economy.
According to many economists, Trump’s campaign to impose tariffs on a wide range of goods from trade partners is unlikely to bring back the manufacturing jobs that once formed the backbone of the blue-collar middle class.
In the mid-20th century, the U.S. was the manufacturing capital of the world, employing more workers in this sector than any other. At its peak in the 1950s, one-fourth of the civilian workforce was engaged in manufacturing.
However, starting in the 1980s, free trade agreements facilitated the relocation of many industries abroad, while automation reduced the need for human labor in the remaining factories. Today, only about 7% of the workforce is employed in manufacturing—a figure that has remained largely unchanged since the Great Recession.
The goal of tariffs is to incentivize businesses to relocate their factories to the U.S. to avoid paying import taxes—costs that are typically passed on to consumers.
While some economists believe this approach could work for select industries, it is unlikely to recreate an era in which most household items carried the “Made in America” label.
According to a report by The Wall Street Journal, while it’s unlikely that the Chinese President will initiate a call himself, the odds of Xi Jinping responding to a call from Trump are reportedly high.
This comes amid heightened tensions between the two nations due to new tariffs and escalating trade disputes, where both sides appear to be locked in a power struggle—neither willing to be the first to back down.
Although this news may seem minor on the surface, it carries a deeper signal for the markets: despite ongoing tensions, the possibility for communication and negotiation remains. This prospect, especially in a highly volatile environment, could be seen as a positive sign by investors.
Earlier in the week, Trump had stated he was waiting for a call from Xi. Now, the Wall Street Journal suggests that if Trump initiates the conversation, a response from China is likely. While this may be an unofficial message from within the Chinese leadership, it still indicates that the door to dialogue and de-escalation is not entirely closed.

SilverXAGUSD
- Rising Wedge as an corrective pattern in short time frame
- Break of Structure
- Demand Zone
- Fibonacci Level - 50.00% / 61.80%
- Completed " 1234 " Impulsive Waves

A Fibonacci 50% Retracement on Silver.A Fibonacci 50% Retracement on Silver, provides another shot at goal for those looking for lower
values!

Potential bullish rise?XAG/USD has bounce off the support level which is a pullback support that aligns with the 38.2% and the 23.6% Fibonacci retracement and could rise from this level to our take profit.
Entry: 30.52
Why we like it:
There is a pullback support level that lines up with the 38.2% and the 23.6% Fibonacci retracement.
Stop loss: 29.57
Why we like it:
There is a pullback support level which lines up with the 61.8% Fibonacci retracement.
Take profit: 31.93
Why we like it:
There is a pullback resistance level which aligns with the 61.8% Fibonacci retracement.
Enjoying your TradingView experience? Review us!
Please be advised that the information presented on TradingView is provided to Vantage (‘Vantage Global Limited’, ‘we’) by a third-party provider (‘Everest Fortune Group’). Please be reminded that you are solely responsible for the trading decisions on your account. There is a very high degree of risk involved in trading. Any information and/or content is intended entirely for research, educational and informational purposes only and does not constitute investment or consultation advice or investment strategy. The information is not tailored to the investment needs of any specific person and therefore does not involve a consideration of any of the investment objectives, financial situation or needs of any viewer that may receive it. Kindly also note that past performance is not a reliable indicator of future results. Actual results may differ materially from those anticipated in forward-looking or past performance statements. We assume no liability as to the accuracy or completeness of any of the information and/or content provided herein and the Company cannot be held responsible for any omission, mistake nor for any loss or damage including without limitation to any loss of profit which may arise from reliance on any information supplied by Everest Fortune Group.
