NASDAQ Buy idea🔸 Structure Breakout → Pullback → Consolidation beneath resistance
🔸 Support Zone Multiple rejections from 19,370–19,385 demand zone
🔸 Liquidity Stops likely resting above 19,420 → potential fuel for breakout move
🔸 Candle Behavior Strong rejection candles from demand zone + no bearish follow-through
🔸 Momentum Price failing to make lower lows → bullish pressure building
US100 trade ideas


Hanzo : NAS100 15m: Breakout Zone Confirmed After Liquidity Trap🆚 Nas100 – Hanzo’s Strike Setup
🔥 Timeframe: 15-Minute (15M)
——————
💯 Main Focus: Bullish After Break at 19950
We are watching this zone closely.
💯 Main Focus: Bearish After Break at 19715
We are watching this zone closely.
———
👌 Market Signs (15M TF):
• Liquidity Grab + CHoCH at 19930
• Liquidity Grab + CHoCH at 19650
• Strong Rejections seen at:
➗ 19750 – Major support / Key level
➗ 20100 – Proven resistance

NASDAQ: 50% probability that this Golden Cross is bearish.Nasdaq is bullish on its 1D technical outlook (RSI = 60.920, MACD = 61.810, ADX = 33.031) as it continues its recovery from the Low of the previous month. In the meantime, it formed a 4H Golden Cross, the first since January 23rd. Even though this is a bullish pattern theoretically, it often doesn't deliver an immediate rise. More specifically, since the October 2022 market bottom, Nasdaq has had another 10 Golden Crosses on the 4H timeframe. The interesting statistic is that 5 have extended their rallies but the other 5 cuased a pullback (short or medium term). Consequently we call for caution in the next 2 weeks, as the market may correct towards the 4H MA200 before it resumes the long term uptrend.
## If you like our free content follow our profile to get more daily ideas. ##
## Comments and likes are greatly appreciated. ##

Hanzo | Nas100 15 min Bearish Break – Next Move is Confirmed 🆚 Nas100 – Hanzo’s Strike Setup
🔥 Timeframe: 15-Minute (15M)
——————
💯 Main Focus: Bearish Break at 19870
We are watching this zone closely.
———
Analysis
👌 Market Signs (15M TF):
• Liquidity Grab + CHoCH at 20030
• Liquidity Grab + CHoCH at 19750
• Strong Rejections seen at:
➗ 19890 – Major support / Key level
➗ 20050 – Proven resistance
🩸 Key Zones to Watch:
• 19950 – 🔥 Bullish breakout level X 7 Swing Retest
• 19980 – Strong resistance (tested 5 times)
• 19900 – Equal lows
• 19980 – Equal highs

When Stocks & Bond Move Opposite Direction - Its implicationWhen Stocks & Bond Move Opposite Direction what does it mean?
We have observed a divergence between the stock and bond markets since 2020. While U.S. Treasury bonds entered a bear zone, the stock markets continued their upward climb. What are the implications of this decoupling?
Will the stock market resume its uptrend and hit new highs? Or is this merely a retracement before further downward pressure?
Micro E-mini Nasdaq Futures and Options
Ticker: MNQ
Minimum fluctuation:
0.25 index points = $0.50
Disclaimer:
• What presented here is not a recommendation, please consult your licensed broker.
• Our mission is to create lateral thinking skills for every investor and trader, knowing when to take a calculated risk with market uncertainty and a bolder risk when opportunity arises.
CME Real-time Market Data help identify trading set-ups in real-time and express my market views. If you have futures in your trading portfolio, you can check out on CME Group data plans available that suit your trading needs www.tradingview.com
Trading the Micro: www.cmegroup.com

Hanzo | Nas100 15 min Breaks – Will Confirm the Next Move🆚 Nas100 – Hanzo’s Strike Setup
🔥 Timeframe: 15-Minute (15M)
——————
💯 Main Focus: Bullish Break Out at 19980
We are watching this zone closely.
💯 Main Focus: Bearish Break at 19890
We are watching this zone closely.
———
Analysis
👌 Market Signs (15M TF):
• Liquidity Grab + CHoCH at 20030
• Liquidity Grab + CHoCH at 19750
• Strong Rejections seen at:
➗ 19890 – Major support / Key level
➗ 20050 – Proven resistance
🩸 Key Zones to Watch:
• 19950 – 🔥 Bullish breakout level X 7 Swing Retest
• 19980 – Strong resistance (tested 5 times)
• 19900 – Equal lows
• 19980 – Equal highs

US100US100 has shown great strength after terrif news.
If we look at the bigger picture, recent bullish rally looks like a pull back. Currently it is heading towards very important region , 20500 which is also the 61% retracement level.
If the price close above 20500 then we can consider it a new bullish rally.

NASDAQ: Rebounding on the 4H MA50. New High for the Channel Up.Nasdaq is marginally bullish on its 1D technical outlook (RSI = 56.883, MACD = 127.320, ADX = 37.197) and is rebounding today on the 4H MA50, right before the HL of the Channel Up. This is a technical bottom that calls for a buy. We aim for a new +6% bullish wave (TP = 20,800).
## If you like our free content follow our profile to get more daily ideas. ##
## Comments and likes are greatly appreciated. ##

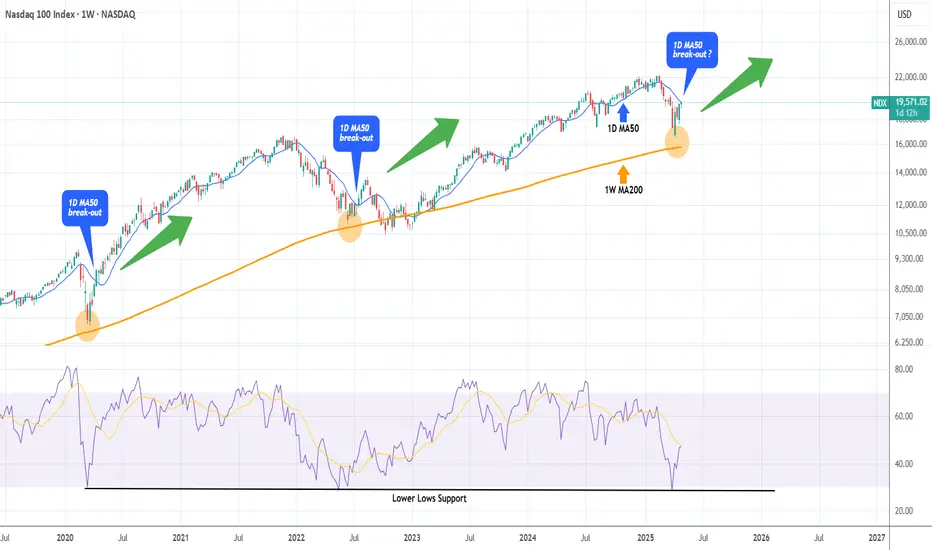
NASDAQ testing its 1D MA50. Break-out or Fake-out?Nasdaq (NDX) has reached its 1D MA50 (blue trend-line) for the first time since February 24. Following the (near) rebound on the 1W MA200 (orange trend-line), this looks like a textbook recovery from a correction to a new long-term Bullish Leg.
Chronologically the last such correction was the March 2020 COVID flash crash, which after it almost touched the 1W MA200, it recovered as fast as the current rebound and when it broke above its 1D MA50, it turned it into the Support of the new long-term Bullish Leg.
What wasn't a break-out but a fake-out was the rebound after the June 13 2022 (near) 1W MA200 rebound, when the break above the 1D MA50 was false as it produced a new rejection and sell-off later on. The difference is that 2022 was a technical Bear Cycle both in terms of length and strength.
Whatever the case, Nasdaq has seen the lowest 1W RSI (oversold) reading among those 3 bottoms. So do you think today's 1D MA50 test is a break-out or fake-out?
-------------------------------------------------------------------------------
** Please LIKE 👍, FOLLOW ✅, SHARE 🙌 and COMMENT ✍ if you enjoy this idea! Also share your ideas and charts in the comments section below! This is best way to keep it relevant, support us, keep the content here free and allow the idea to reach as many people as possible. **
-------------------------------------------------------------------------------
💸💸💸💸💸💸
👇 👇 👇 👇 👇 👇
NASDAQ-100 Head & Shoulders Breakdown?I've been tracking a potential head and shoulders pattern on the NASDAQ-100, with a neckline at 17,720. If the pattern completes and breaks down convincingly, the measured move projects a target near 13,200 — a significant potential drop.
While technical patterns aren’t guarantees, they often coincide with underlying fundamentals. In this case, there are several macroeconomic headwinds that could catalyze such a decline:
Sticky Inflation and Interest Rate Uncertainty: Despite some progress, inflation remains above the Fed’s target. A “higher for longer” rate environment continues to pressure equity valuations, especially in tech-heavy indexes like the NASDAQ-100.
Weakening Consumer and Corporate Spending: Retail sales and corporate earnings revisions have shown signs of fatigue, suggesting slowing momentum in key economic drivers.
Global Tensions and Supply Chain Risks: Ongoing geopolitical instability, including issues in the Middle East and renewed U.S.–China trade rhetoric, could reignite volatility and affect global growth assumptions.
Overvaluation and Narrow Market Breadth: A small group of mega-cap tech names have driven much of the recent rally, leaving the broader market vulnerable if leadership falters.
With technical and fundamental factors aligning, this setup is worth watching closely. A confirmed break below the neckline could be more than just a chart pattern—it may reflect a broader shift in sentiment.

Don't let the Recession paralysed you !!!!Read these few articles here , here and here
If you buy into any of the above articles as the gospel truth, you may freak out and starts to sell your holdings in US as some gurus advised you to do so. Take a step back and asked - WHY ?
Is the content creator saying this out of your interests or his ? Remember, positive news seldom receive likes and sharing but negative on the other hand will receive more. That is why it is easier to spell doom, gloom and boom and have lots of people liking it !
Of the 3 main indices, the Tech stocks have already gotten out of the woods as it has been up more than 20% from the bottom. SPX and DJA are still playing catch up. Due to the tariffs, many goods produced in US and are sold in China are now seeing dwindling sales. Patriotism or "guo chao" in Chinese is the anti-US sentiments that is now hot in China. That means the locals will rather buy Anta or Li Ning sports shoes over Nike or Adidas. Same for cosmetics!
There are some technical chartists or analysts saying this is a dead cat bounce and once the price hit the support line (in purple), it will continue to sell down. Yes, it is possible though I think it is less probable.
6 months down the road when we look back and IF I am lucky and predicted correctly, there will be many people who will kick themselves for missing a nice bottom buy on 9th April (thanks to Donald Trump who tweeted it).
Timing the market is TOUGH as I had learnt my lessons . WB , the legendary guru is right - be in the market meaning invest in the market for the long haul in fundamentally strong companies with economic moat and strong cash flows, etc will reap better returns.
As usual, please DYODD

NASDAQ INDEX (US100): Time for Pullback
There is a high chance that US100 will retrace from the underlined
blue daily resistance.
I spotted a double top pattern on a 4h time frame after its test
and a nice bearish imbalance candle that was formed
during the NY session yesterday as confirmations.
Goal - 19590
❤️Please, support my work with like, thank you!❤️


Nasdaq 100 off lows on Bessent remarksUS stocks trimmed their earlier losses after the Trump administration delivered the latest dose of jawboning. This time it was trade secretary Scott Bessent, saying trade negotiations with several partners are going well and that there is a possibility of “substantial reduction” in tariffs on US goods. He added some deals could be announced as early as this week. That was enough to trigged dip-buying, causing major indices like the Nasdaq to bounce off their earlier lows.
The Nasdaq has found a bit of resistance in the last couple of days from the area shaded on the chart between 20,000 to around 20,150 where it had previously encountered support. See area shaded on the chart. A closing break above here is what the bulls would be eying this week, although for that to happen, some trade deals may well have to be announced first.
By Fawad Razaqzada market analysts with FOREX.com

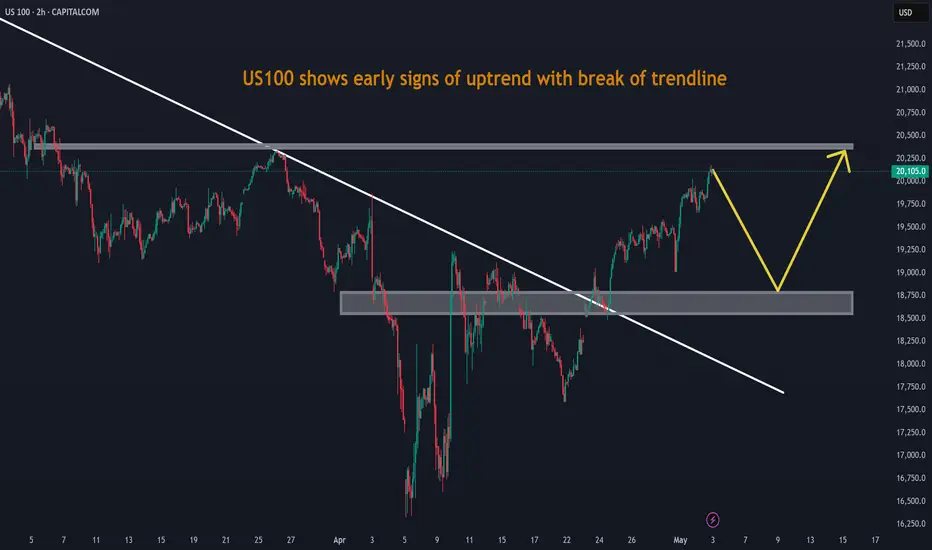
US100 shows early signs of uptrend with break of trendlineUS100 shows early signs of uptrend with break of trendline. It may retrace before upward momentum.
Descending Triangle Formation with Bullish Breakout Potential The NASDAQ (US100) is currently forming a descending triangle pattern with a clear A-B-C-D-E wave structure, signaling price compression and consolidation.
🔍 Key Insights:
The previous move was strongly bullish, increasing the probability of a continuation after consolidation.
A potential breakout above the descending trendline (blue resistance) could trigger a sharp upward move.
Target zones:
✅ First target: 20,060.6
✅ Second target: 20,573.9
Key support zone: 19,524.7 – this area acted as a launchpad for the previous bullish impulse and confirms the base of the triangle.
🧠 Suggested Strategy:
Wait for a confirmed breakout with volume. Look for entries on a pullback toward the 19,811.1 zone – ideally with a bullish continuation candle.
📊 Additional Context:
These types of consolidation patterns often lead to explosive moves. Patience and risk management will be crucial here.

NAS100USD: SMT Divergence Hints at Potential ReversalGreetings Traders,
In today’s analysis of NAS100USD, although the current market structure reflects bearish institutional order flow, there are growing signs that a potential reversal may be forming.
Key Observations:
1. Smart Money Technique (SMT) Divergence:
We are currently observing SMT divergence—a strategy where the underlying asset (NAS100) is compared against its benchmark (US500). These indices typically maintain a 90–100% correlation. However, when this correlation breaks down, it often signals that a reversal may be imminent. In this case, while NAS100 continues to show bearish momentum, the divergence from US500 suggests the possibility of bullish interest building.
2. Institutional Support at the Rejection Block:
Further confluence for a potential reversal lies in the presence of a rejection block acting as a strong institutional support level. This is a zone where smart money previously defended price, and if confirmed, it could provide an optimal entry for long positions.
Trading Plan:
We will monitor the rejection block for confirmation of bullish intent before entering any trades. If confirmed, the idea is to target the buy-side liquidity residing in premium pricing zones.
Invalidation Level : This reversal idea will be invalidated if NAS500 breaks below its most recent swing low.
Stay alert for confirmation, and always ensure the idea fits within your broader trading framework.
Kind regards,
The Architect

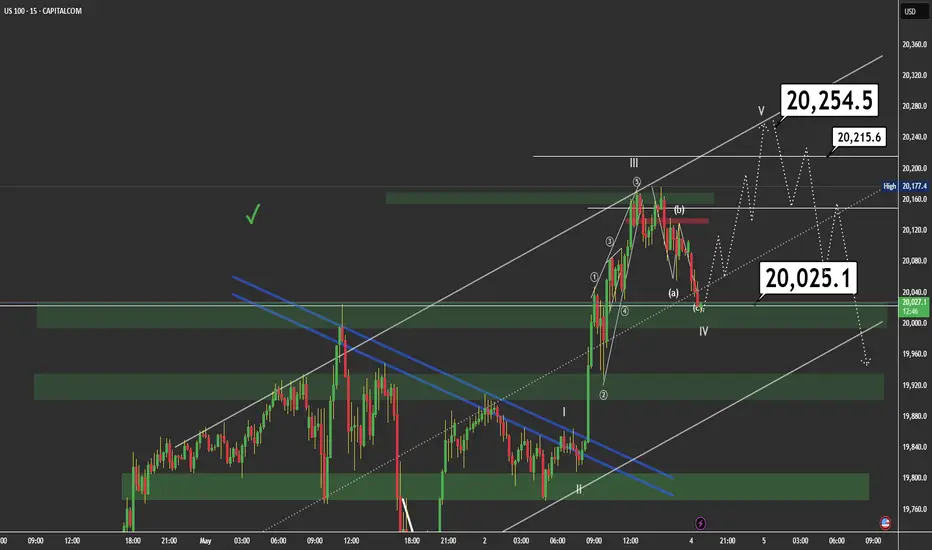
Wave V in PlayThe market appears to have completed a corrective wave IV, forming an ABC structure that tapped into the key demand zone around 20,025.1. This zone aligns with previous structure support, the lower boundary of the ascending channel, and a critical trendline.
🔍 Likely scenario:
If price holds above this level, we could be witnessing the beginning of wave V, with potential targets near 20,254.5.
Wave V is expected to unfold in 5 smaller internal waves and may extend further if price breaks through the mid-channel resistance.
🚨 🔺 CRUCIAL LEVEL TO WATCH: The 20,215 area is extremely important. Price reaction here will be decisive:
A strong rejection could signal a truncated wave V or the start of a deeper correction.
A clean breakout would confirm bullish continuation toward 20,254.5 and beyond.
🟢 Key Zones:
📌 Demand: 20,025 – 20,000
📌 Critical Resistance: 20,215
📌 Wave V Target: 20,254.5
📌 Invalidation level: A drop below 19,975 would invalidate the current bullish count.
📌 Trade Plan:
Look for bullish confirmation at 20,025 to consider long setups.
Watch 20,215 closely for signs of strength or rejection. If price breaks above it with momentum, continuation is likely.
Nasdaq100 M30Last week NFP failed to push investors price high , while this our chance to hit the lows

NAS100 – Supply Zone Rejection! Are Tech Bulls Out of Breath?Timeframe: 4H | Methodology: Supply & Demand + Structure
The NASDAQ 100 (US100) is struggling to break above the key supply zone around 19,832. Price has printed multiple wicks at resistance, hinting at weakening bullish momentum.
Technical Breakdown:
Major Supply Zone: 19,800 – 19,850
Critical Support Level: 18,846
Demand Zone Target: 17,700 – 18,000 (highlighted in orange)
Key Observations:
Price has rallied into supply after a strong bullish move from the 18,000s
Repeated rejection candles are forming inside the supply zone
Bearish divergence may be developing — a possible early reversal signal
Trade Setup Idea: (Bearish Bias)
Sell Trigger: Break below 19,700
Target Range: 18,850 first, then 18,000
Stop Loss: Above 19,850
Macro Note:
Several U.S. economic events are lined up (see calendar icons). Expect high volatility — perfect environment for trap moves and liquidity grabs.
Will NAS100 reverse from this zone or break out to new highs? Let me know your view!
Like & follow for more clean chart breakdowns.
#NAS100 #NASDAQ #USTech #SupplyAndDemand #PriceAction #TechnicalAnalysis #SmartMoney #ReversalSetup #TradingView

SHORT ON NAS100Nice Double Top on NAS at a major resistance level.
I will be selling nas to the next demand level for 2000-3000 points.

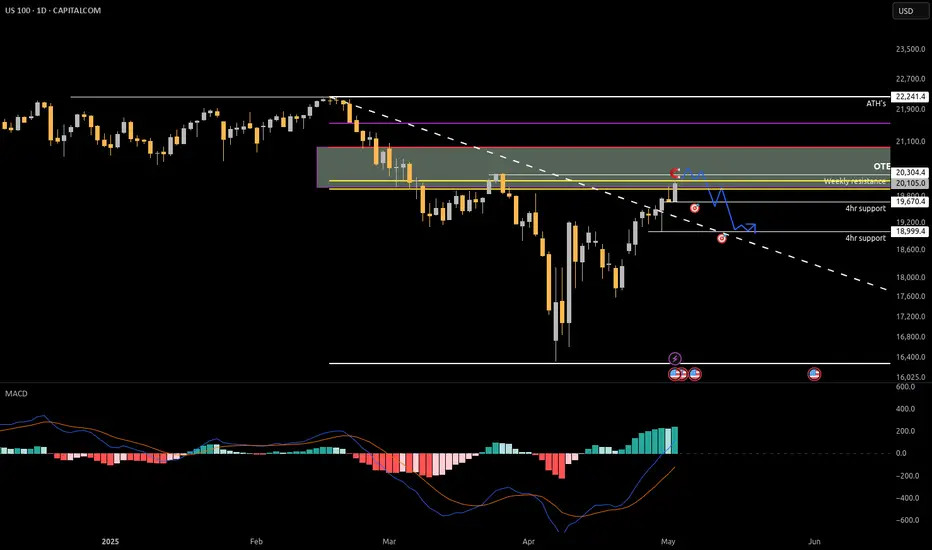
Short idea Us100, sweep of weekly resistancePrice is nearing the weekly resistance after extremely bullish price, expecting price to start stalling next week as it pushes in to the golden pocket zone where we'll see a move down and some higher lows lock in.
Ill be looking for a short entry on a low volume move up on the 5 minute time frame after we've taken the external liquidity above the weekly resistance level