SOL Analysis Deep Dive: Identifying Optimal Entry and Exit ZonesYesterday, SOL gave a sharp downside shakeout, dropping from the weekly open at $147.98 (perfectly retested) down to the 0.5 Fib retracement of the swing at $140.25. Here’s a structured breakdown of the key levels, trade setups, and R:R profiles for both longs and shorts:
🔑 Key Levels & Confluence

Solana (SOL): Re-Testing Major Moving Average Line | 200 EMASolana has reached the 200EMA line on the daily timeframe, which has been broken recently after a long rally to upper zones. We caught 2 possible trades here, where one would be 1:5 RR and the second one would be 1:3 RR.
More in-depth info is in the video—enjoy!
Swallow Academy

BEARISH SENTIMENT ON SOLUSDTConfluences for the trade are:
1) Market Structure(BoS), 2) Liquidity, 3) QM-Orderblock(POI).
To target a 1:2.5RR minimum.
Note: the market is all about probabilities which also makes my analysis a probability.

SOL - Strong Structure Rejected!Hello TradingView Family / Fellow Traders! This is Richard, also known as theSignalyst.
The picture says it all!
📈As long as the $134 structure marked in red holds, I will be expecting a bullish continuation towards the $180 resistance level.
📚 Reminder:
Always stick to your trading plan — ent

SOL USDT LONG TRADE SETUPSOL is currently holding a strong support level , with a high probability of the price moving upwards. Additionally, other indicators, such as the 50 EMA, are also acting as support .

Lingrid | SOLUSDT Consolidation After KEY Resistance BreakThe price perfectly fulfilled my previous idea . BINANCE:SOLUSDT market has effectively bounced off the support level and continues moving higher. The price has established a significant swap zone around the 135.00 level, where it has repeatedly found resistance or support in previous tests.
Re

Short SolanaSOL broke through the ascending trendline and the support level. The decline to a support level at $123.9 is expected to happen

Solana Classic Signals (5 Total) & Bullish ConfirmationIt is the first time that Solana moves back above EMA55 after producing a major low since late 2024. Naturally, when this event happened back in late 2024 what followed was a bullish impulse. This is always the case as this is a confirmed classic bullish signal.
Solana is trading daily above EMA55

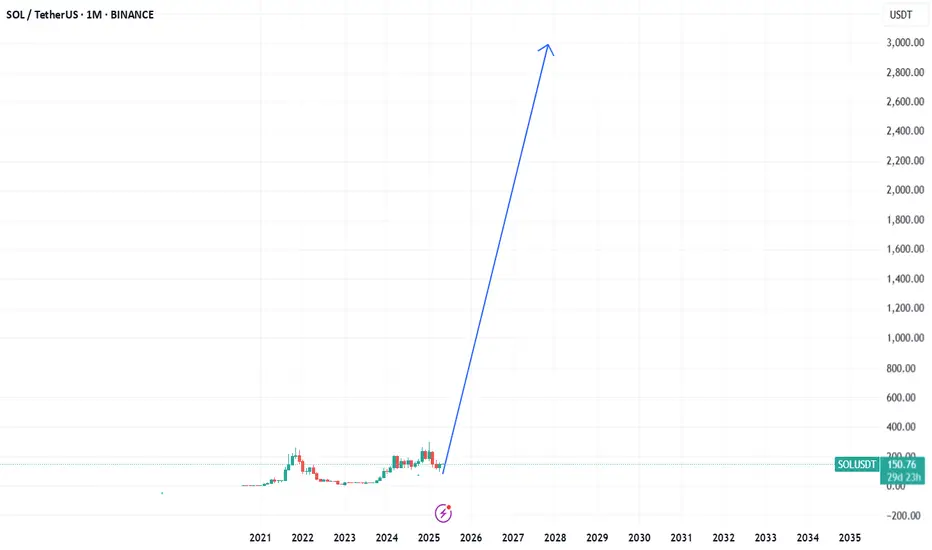
Solana similar to Tesla before it blow up, most used crypto 85% of the blockchain usage is in Solana,
Currently setting very low realtively to BTC,
Solana is the new Ethereum
3400$ should be coming !
SOL Targets $175 With 20% Surge From Key SupportHello and greetings to all the crypto enthusiasts, ✌
All previous targets were nailed ✅! Now, let’s dive into a full analysis of the upcoming price potential for Solana 🔍📈.
Solana is currently trading within a strong descending channel. I anticipate a potential 20% price increase in the coming da

See all ideas
Summarizing what the indicators are suggesting.
Oscillators
Neutral
SellBuy
Strong sellStrong buy
Strong sellSellNeutralBuyStrong buy
Oscillators
Neutral
SellBuy
Strong sellStrong buy
Strong sellSellNeutralBuyStrong buy
Summary
Neutral
SellBuy
Strong sellStrong buy
Strong sellSellNeutralBuyStrong buy
Summary
Neutral
SellBuy
Strong sellStrong buy
Strong sellSellNeutralBuyStrong buy
Summary
Neutral
SellBuy
Strong sellStrong buy
Strong sellSellNeutralBuyStrong buy
Moving Averages
Neutral
SellBuy
Strong sellStrong buy
Strong sellSellNeutralBuyStrong buy
Moving Averages
Neutral
SellBuy
Strong sellStrong buy
Strong sellSellNeutralBuyStrong buy
Displays a symbol's price movements over previous years to identify recurring trends.