SOL Analysis Deep Dive: Identifying Optimal Entry and Exit ZonesYesterday, SOL gave a sharp downside shakeout, dropping from the weekly open at $147.98 (perfectly retested) down to the 0.5 Fib retracement of the swing at $140.25. Here’s a structured breakdown of the key levels, trade setups, and R:R profiles for both longs and shorts:
🔑 Key Levels & Confluences
1. Higher-Timeframe Opens
Weekly Open & Retest: $147.98 – pivoted price before the drop
Monthly & Prior-Day Open Cluster: $147.98–$146.31 – strong support confluence zone
2. Fibonacci Support Zones
0.5 Fib at $140.25 – primary mean-reversion entry
0.786 Fib (smaller wave) at $138.78 – secondary, deeper support
3. Order Block
Daily Bullish Order Block at $139.87 – just below 0.5 Fib, adds extra support
4. Volume-Weighted Average Price
Anchored VWAP (from ATH $295.83) at ~$166.45 – key upside resistance
5. Market Profile Value Areas (10-Day Range)
Value Area High (VAH) at ~$153.00 – overhead resistance confluence
Value Area Low (VAL) at ~$145.75 – underpins support
📈 Long Trade Setups
1. 0.5/0.786 Fib + Daily Bullish Order Block
Entry: $141-138.78
Stop-Loss: $137.5
Target: $165 (anchored VWAP / Fib zones)
R:R ≈ 9:1
2. Higher-Timeframe Open Cluster
Entry Zone: $147.98–$146.31(monthly/weekly open)
Stop-Loss: $142.5
Target: $165
R:R ≈ 3:1
• Why these levels? The 0.5 Fib is a classic mean-reversion zone, bolstered by the daily order block. The $147–146 zone ties together multiple opens (weekly, monthly, prior-day), offering a solid demand area if price retraces back up.
📉 Short Trade Setup
Trigger: Rejection / swing-failure around $153.4
Entry: $153.4
Stop-Loss: $154.3
Target: Weekly/Monthly open (~$147)
R:R ≈ 6:1
• Low-risk short: A clean rejection at the recent high lets you define risk tightly above the swing, aiming to capture the retrace back to the opens.
🎯 Summary & Game Plan
Primary bias: Look for long entries at the 0.5 Fib ($140.25) or the open-cluster zone ($147–146), with targets toward the anchored VWAP at ~$166.
Alternate bias: A short on clear rejection from $153.4, targeting the opens as support.
Risk management: Keep stops tight (SL below $137.5 or above $154.3) to maximize R:R on your favored setups.
Volume & Price Action: Confirm entries with an uptick in volume or bullish price structure (for longs) or swift failure patterns (for shorts).
Now it’s a waiting game! Let price revisit these zones, watch for confirmation signals, and then scale into your chosen side. Good luck! Don't chase, let the charts come to you!
____________________________________
If you found this helpful, leave a like and comment below! Got requests for the next technical analysis? Let me know.
SOLUSDT.PS trade ideas

SOL - Strong Structure Rejected!Hello TradingView Family / Fellow Traders! This is Richard, also known as theSignalyst.
The picture says it all!
📈As long as the $134 structure marked in red holds, I will be expecting a bullish continuation towards the $180 resistance level.
📚 Reminder:
Always stick to your trading plan — entry, risk management, and trade management are key.
Good luck, and happy trading!
All Strategies Are Good, If Managed Properly!
~Rich

Solana Builds Bullish Case – Targeting $170 With 17% UpsideHello and greetings to all the crypto enthusiasts, ✌
All previous targets were nailed ✅! Now, let’s dive into a full analysis of the upcoming price potential for Solana 🔍📈.
Solana is showing strong accumulation within a tight range, with increasing volume suggesting strategic positioning by larger players. Price action is approaching a critical support zone, adding confluence to the bullish bias. A potential upside of at least 17% is in play, with the primary target set at $170. 📈
🧨 Our team's main opinion is: 🧨
Solana is consolidating near key support with strong whale activity—looking for at least **17% upside** toward the **\$170** target. 🚀
Give me some energy !!
✨We invest hours crafting valuable ideas, and your support means everything—feel free to ask questions in the comments! 😊💬
Cheers, Mad Whale. 🐋

BEARISH SENTIMENT ON SOLUSDTConfluences for the trade are:
1) Market Structure(BoS), 2) Liquidity, 3) QM-Orderblock(POI).
To target a 1:2.5RR minimum.
Note: the market is all about probabilities which also makes my analysis a probability.

Solana (SOL): Re-Testing Major Moving Average Line | 200 EMASolana has reached the 200EMA line on the daily timeframe, which has been broken recently after a long rally to upper zones. We caught 2 possible trades here, where one would be 1:5 RR and the second one would be 1:3 RR.
More in-depth info is in the video—enjoy!
Swallow Academy

SOLUSDT Reversal Brewing — Watch This Level or Get Wrecked!Yello Paradisers — Are you paying attention to #SOLUSDT? Because what’s forming right now isn’t just noise — it’s a high-probability reversal setup that could trap the late bulls or become the kind of move that sets the tone for the next few weeks. Either way, the next play is going to separate professionals from gamblers. Let’s talk.
💎#SOLUSDT has been printing textbook bearish price action for weeks — lower lows and lower highs on the major time frame. But something critical has just changed. A break in market structure has occurred, and we’ve now got a higher high. That’s your first probable signal that the tide may be turning. Now comes the most important test — can we form the higher low to confirm this shift?
💎What makes this setup even more interesting is that we’re not just seeing a random bounce. SOL is in the middle of potentially probable completing two major bullish reversal patterns — an inverse head and shoulders and a Quasimodo. The left shoulder and neckline are already locked in. The right shoulder? Still cooking. But here’s the thing — the previous resistance, which aligns perfectly with where the right shoulder could form, is lining up as a textbook retest zone. That means we could get the higher low right there, completing both patterns at once.
💎Right now, price is struggling against multi-timeframe resistance, and that’s exactly what we want. It increases the probability of a short-term pullback to the key zone — around 110.9 to 115 — before the real breakout happens. If that level holds, and we print a confirmed higher low, this whole setup becomes explosive.
💎First area of resistance sits at 153, but that’s just the appetizer. The main zone we’re looking at is 173 to 181. That’s the bigger move that this structure is potentially building toward. But let’s be clear — if SOLUSDT closes a candle below 110.9, the entire setup gets invalidated. That level is your line in the sand.
This is the kind of setup we live for — clean structure, clear invalidation, and serious upside potential. But don’t rush it. The market will reward the ones who wait, not those who chase. Let others panic. Let others fomo. You focus on execution.
Trade smart, Paradisers — and always remember, only a few will catch the real move. Be one of them.
MyCryptoParadise
iFeel the success🌴

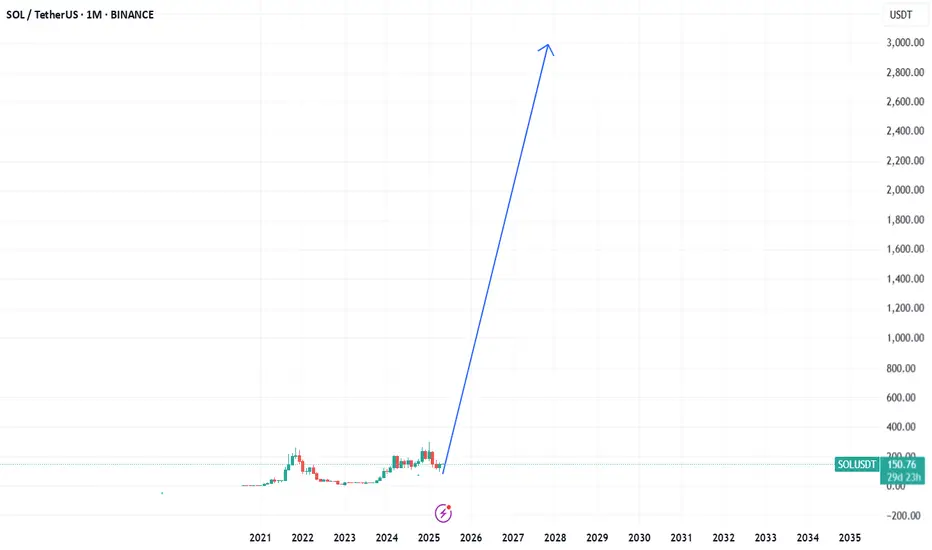
Solana similar to Tesla before it blow up, most used crypto 85% of the blockchain usage is in Solana,
Currently setting very low realtively to BTC,
Solana is the new Ethereum
3400$ should be coming !
SOL/USDT downtrend continuation or just a fakeout?The price was in a strong downtrend but started to range...where the price did not break either side...but now its broke trought the bottom support and we now need to wait for confirmation if the price will bounce off down or break back in to range and bounce to the upper ressistance level.
Short SolanaSOL broke through the ascending trendline and the support level. The decline to a support level at $123.9 is expected to happen

Solana SOL price analysisToday, a press release was published that CRYPTOCAP:SOL Strategies (aka MicroStrategy from the world of #Solana) bought another 122,524 CRYPTOCAP:SOL at $149
Earlier, the company said it would sell $500mn in convertible bonds, to buy #Solana, which capitalized now is at $74bn
Well, if you look at the OKX:SOLUSDT chart, we can say that it would be good to keep the price above $107-115, above the trendline, which has been going on since the beginning of 2023.
Once this condition is met, we can start dreaming again about the start of a super march of the #SOLUSD price to $790 in 2025.
_____________________
Did you like our analysis? Leave a comment, like, and follow to get more


sol buy midterm"🌟 Welcome to Golden Candle! 🌟
We're a team of 📈 passionate traders 📉 who love sharing our 🔍 technical analysis insights 🔎 with the TradingView community. 🌎
Our goal is to provide 💡 valuable perspectives 💡 on market trends and patterns, but 🚫 please note that our analyses are not intended as buy or sell recommendations. 🚫
Instead, they reflect our own 💭 personal attitudes and thoughts. 💭
Follow along and 📚 learn 📚 from our analyses! 📊💡"

Lingrid | SOLUSDT Consolidation After KEY Resistance BreakThe price perfectly fulfilled my previous idea . BINANCE:SOLUSDT market has effectively bounced off the support level and continues moving higher. The price has established a significant swap zone around the 135.00 level, where it has repeatedly found resistance or support in previous tests.
Recently, the market broke and closed above the 140.00 resistance zone, and following this breakout, the market has entered a consolidation phase, suggesting it may continue moving sideways in the near term. However, if the price pulls back toward the established swap zone, we can anticipate continuation of the current bullish trend. This consolidation pattern following a resistance break often signals strengthening market conviction before the next meaningful advance. My goal is resistance zone around 165.00
Traders, if you liked this idea or if you have your own opinion about it, write in the comments. I will be glad 👩💻

DeGRAM | SOLUSD Held the $145 level📊 Technical Analysis
● SOL broke above the long-term descending resistance near $130 and held it on a retest, confirming a bullish reversal.
● A consolidative range between $145 support and $154 supply has formed; a decisive break above $154 targets the rising-channel top near $160.
💡 Fundamental Analysis
● SOL staking volume recently surpassed Ethereum’s, underlining robust on-chain yield demand.
● DeFi Development Corp filed to offer $1 billion in securities to boost SOL holdings, signaling institutional accumulation.
✨ Summary
Resistance-turned-support at $145, strong staking growth, and corporate demand support a short-term long bias: targets $154 → $160; invalidation below $140.
-------------------
Share your opinion in the comments and support the idea with a like. Thanks for your support!

Solana Classic Signals (5 Total) & Bullish ConfirmationIt is the first time that Solana moves back above EMA55 after producing a major low since late 2024. Naturally, when this event happened back in late 2024 what followed was a bullish impulse. This is always the case as this is a confirmed classic bullish signal.
Solana is trading daily above EMA55 and this confirms mid-term growth potential.
The low happened 7-April and produced the highest buy volume in more than a year, since March 2024.
The difference is that March 2024 was a peak while April 2025 was a bottom. The volume signal is another classic.
The RSI is really strong with a reading reaching ~60.
The MACD is on the bullish zone now, it has been trading in this zone since 19-April.
There is a broken downtrend line (black) and this is another classic.
We have a total of five classic signals and we used these one hundred trillion times in the past few years to predict how the market would behave next. The list goes as follows:
» Moving averages
» Volume indicator
» Oscillators (MACD & RSI)
» Chart patterns
» Trendlines
Another one that we use very often is candlestick reading. Even if it is not mentioned in the analysis, it is always there. The bottom is confirmed with a reversal candlestick pattern.
» These are some of the classic signals, all bullish. Bullish means up. Solana is going up.
Thank you for reading.
Namaste.


Long trade
15min TF overview
📘 Trade Journal Entry
SOLUSDT (Buy Side)
🗓 Date: Saturday, 3rd May 2025
⏰ Time: 5:09 PM
📍 Session: New York PM
⏱ Timeframe: 30-second chart
Pair: SOL/USDT
📈 Direction: Long (Buy Side)
🔹 Entry Details:
Entry Price: 146.876
Take Profit: 148.302 (+0.97%)
Stop Loss: 146.838 (−0.03%)
Risk-Reward Ratio: 37.53
🔹 Trade Context:
Executed on a 30-second timeframe during the late NY session, where volume often consolidates or traps late shorts for a buyside trade idea.
30sec overview

SOL 2025.05.01***Follow SEOVEREIGN to receive alerts.
**Boosts motivate SEOVEREIGN to analyze more assets.
**Our team regularly publishes analysis reports on the cryptocurrency market.
Short-Term Bearish Scenario for Solana
Currently, Solana appears to be forming a 1.13 Bat Pattern, a technical setup that suggests a potential short-term decline.
This could present an opportunity for those trading futures to consider a short position strategy.
Target 1: 149
Target 2: 145
Be sure to manage your risk properly and set a stop-loss level before entering a trade.
Continue monitoring the pattern's validity throughout the setup.

#SOL/USDT#SOL
The price is moving within a descending channel on the 1-hour frame, adhering well to it, and is on its way to breaking it strongly upwards and retesting it.
We are seeing a bounce from the lower boundary of the descending channel, this support is at 144.
We have a downtrend on the RSI indicator that is about to break and retest, which supports the upward trend.
We are looking for stability above the 100 moving average.
Entry price: 149
First target: 153
Second target: 156
Third target: 161

long entry on SOLEntry at $142.52, tight stop at $138.76, take profit 50% at 157.13, take profit 100% at $178.95

Solana dump to $146.32Just now hopped into a solana short short. Targeting $146.32 area.
Seems like pretty obvious trade.
DTT applied.
Strop and Tp on chart.

SOL looking good📊 SOL — Strong Support & Whale Activity Signal Potential Long Opportunity
🔎 Market Trend Overview
SOL, BTC, and ETH are all neutral, consolidating near their 21-day EMA after recent volatility.
Token Trend Current Price 21-day EMA Relationship
SOL Neutral $144.83 ~$143.50 Price near EMA
BTC Neutral $94,091 ~$93,500 Price near EMA
ETH Neutral $1,807 ~$1,800 Price near EMA
🐳 Notable SOL Whale Positions
Several large players have positioned both long and short — but the biggest exposure is clustered near current price levels:
Whale Position Size Entry PnL Notes
0x4a20 LONG (20x) $38.8M $144.90 +$9k Aggressive long
0xECB6 SHORT $6.6M $145.24 +$15k Part of portfolio
dydx1eq… LONG $5.8M $136.12 +$1.5k Moderate size
dydx1fn… SHORT $3.5M $250.82 +$475k Deep in profit
0x2c2f SHORT $1.9M $186.28 +$738k Very profitable
📍 Key SOL Liquidity Levels
Watch for these levels — heavy liquidation leverage suggests strong defense/support.
Level Liquidation USD Significance
$148.80 $45.7M Major resistance
$149.00 $45.6M Resistance cluster
$142.20 $43.8M Support level
$141.60 $41.5M Strong support
$141.40 $38.6M Support cluster
🚀 Trade Idea — Long SOL at Support
Entry: $141.50–$142.00
Stop: $138.50
Target: $148.50
R/R Ratio: 1:2.33
Safety Score: 8/10
Bias: Short-term bullish (3–5 days)
Rationale: Entering near a key support cluster where whales are positioned and liquidation leverage is high — signaling likely defense and bounce potential.

SOL Daily – Bullish Break of Structure with Trendline ReversalSolana is currently trading around $146, having broken out of the descending trendline and confirmed a bullish break of structure (BoS) to the upside. This signals a shift in market direction, now favoring long setups.
The price is above the Ichimoku cloud, with Span A at $140.00 and Span B at $126.13, confirming the bullish trend is supported not just by price action but also by momentum structure. The cloud is angled upward, reinforcing that bullish continuation remains the most likely scenario.
The optimal entry zone lies between $126.36 and $112.45, a key support area that previously acted as resistance and has since been validated by multiple reactions. A retracement into this zone would offer a high probability long setup, particularly if combined with a short-term TSI reset or bullish candlestick signal.
The Trend Strength Index (TSI) supports this scenario:
TSI(20): 0.89 — strong bullish momentum
TSI(10): 0.19 — early in the cycle, with potential for expansion
The main bullish target is $256.00, which aligns with the next macro resistance zone and offers a risk-to-reward ratio 1:4.
Trade Setup Summary:
Entry Zone: $126.36 – $112.45
Target: $256.00
Stop Loss: Below $95
Solana remains one of the top-performing Layer 1 blockchains in terms of throughput, user activity, and developer interest. Its low fees and high speed have supported growing ecosystems in DeFi, NFTs, and consumer apps. Despite past setbacks, recent improvements in network stability and increased institutional attention have reignited bullish sentiment. With the market shifting into broader altcoin rotation, Solana is well-positioned to benefit from renewed investor flows.
Disclaimer: This content is for educational and informational purposes only. It does not represent financial advice or a recommendation to buy or sell any financial instrument. Trading involves risk, and you should only trade with money you can afford to lose.
