Nothing !!!Currently, SOL is forming an ascending triangle, indicating a potential price increase. It is anticipated that the price could rise, aligning with the projected price movement (AB=CD).
However, it is crucial to wait for the triangle to break before taking any action.
Give me some energy !!
✨We spend hours finding potential opportunities and writing useful ideas, we would be happy if you support us.
Best regards CobraVanguard.💚
_ _ _ _ __ _ _ _ _ _ _ _ _ _ _ _ _ _ _ _ _ _ _ _ _ _ _ _ _ _ _ _
✅Thank you, and for more ideas, hit ❤️Like❤️ and 🌟Follow🌟!
⚠️Things can change...
The markets are always changing and even with all these signals, the market changes tend to be strong and fast!!
SOLUSDT.PS trade ideas

Bearish ScenarioI'm seeing a possible Bearish Harmonic White Swan Pattern. If you are to look at the liquidity heat map, there's a lot of liquidity in 207 - 210 region. A possible short scenario from there. Manage your risk :)

SOLUSDT NEXT MOVESell after bearish candle stick pattern, buy after bullish candle stick pattern....
Best bullish pattern , engulfing candle or green hammer
Best bearish pattern , engulfing candle or red shooting star
NOTE: IF YOU CAN'T SEE ANY OF TOP PATTERN IN THE ZONE DO NOT ENTER
Stop lost before pattern
R/R %1/%3
Trade in 5 Min Timeframe, use signals for scalping

solonaAnalysis:
The price has shown significant volatility, with a notable peak at 258.62 USDT.
The projected high of 392.77 USDT by mid-2025 suggests a bullish long-term outlook.
The immediate resistance at 157.93 USDT is a key level to watch for potential breakouts.
Support at 128.98 USDT is crucial; a break below this level could see the price testing lower supports at 90.22 USDT and 50.00 USDT.
Recommendations:
For Traders: Consider buying near support levels (128.98 USDT and 90.22 USDT) and selling near resistance levels (157.93 USDT and 249.70 USDT).
For Long-term Investors: The projected high of 392.77 USDT indicates potential for significant growth, making it a candidate for long-term holding.
This analysis is based on the currently available information and data. It should be supplemented with additional technical and fundamental analysis for more accurate trading decisions."

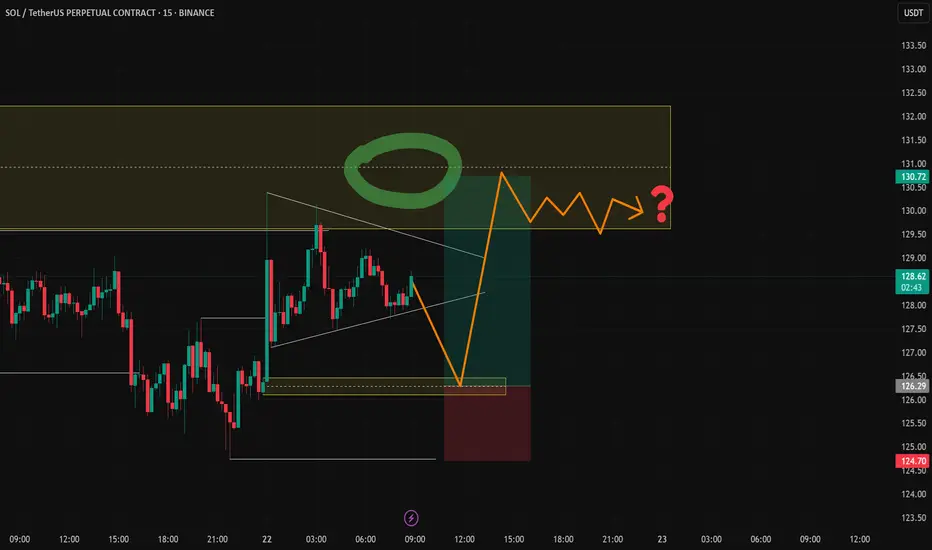
solana trade setup 15min chart* if you are trading on market orders need to set limit order *
i say this because last week it has going all directions and playing with strict levels are important
just spotted a triangle forming which could be drying up in volume as of recording this chart setup it saturday where major market remains closed the volume and volatility will be low
buy area 126-126.50 target 130.5 to 131 sl 124.70-50
triangle is trap for liquidation be careful !!
SOLUSDT#sol looking good to make a bullish run all d way to 144-145$, a rejection at dis level would confirm a double top on d daily where price is expected to make a reversal all d way down to 90-80$..

SOLANA'S ASCENDING TRIANGLESolana is forming a textbook ascending triangle on the 4-hour chart, which is generally considered a bullish pattern. Ascending triangles are characterized by higher lows (signaling increasing buying pressure) and a flat resistance line at the top – in this case, around $136.
The structure indicates that buyers are stepping in at progressively higher levels, tightening the price action into a wedge. If Solana breaks out above the flat top with volume, the measured move target would be calculated by taking the height of the triangle and adding it to the breakout point – which could easily send Solana toward $160 or higher.
However, the 50 MA (blue line) is acting as resistance right now, which means bulls need to reclaim that level first to build momentum. A breakdown below the rising trendline would invalidate the bullish setup and could lead to a retest of the $120 zone. For now, the structure remains intact, but a decisive move is coming soon.
Price can break support and still remain a technical ascending triangle - as long as we continue to see higher lows.
Traders generally wait for a break of the flat resistance on top, so keep this one marked.

Solana’s Cup-and-Handle Setup: A Bullish Trap or Opportunity?Recent analysis suggests Solana (SOL) is forming a large cup-and-handle pattern, with a potential false breakout on the fifth wave before a flash crash in mid to late April. Some traders believe this correction could set the stage for a stronger breakout on the seventh wave, possibly pushing SOL past its current pattern high and toward the upper boundary of a broadening wedge formation. Despite short-term volatility, this multi-year structure supports a long-term bullish outlook.
In the near term, market structure remains uncertain, with SOL facing downward pressure despite bouncing from $120. While this level has historically been strong support, the depth of the correction and multiple broken levels suggest caution. Analysts remain divided on the next move—some expect consolidation between $120 and $180, while others warn of a potential drop to $80 if market conditions worsen. Monitoring key support and resistance levels will be crucial for traders navigating the next phase.

SOL/USDT BIG PUSH DOWN....ELITE ZONE RETURN?The price made a bigg fall...but since the price usually doesn't just fall and keep falling but makes retracements there is a possibility for the price to actually return to the middle zone where it could then bounce and continute the fall...but overall it is very close to the bottom so it could first then bounce from the bottom zone and than make a return. Dont forget the return can be all the way to the zone OR...just a 50%retracement...so be carefull.

SOL - One SOL for a SOULThe Guided help can help you enjoy some sol move. THE untested OB can proove to do wonders!!

SOL/USDT 1H: Bullish Trend Holding – Can $137 Be Reached?SOL/USDT 1H: Bullish Trend Holding – Can $137 Be Reached?
🚀 Follow me on TradingView if you respect our charts! 📈 Daily updates!
Current Market Conditions (Confidence: 8/10):
Price at $134.34, confirming strong momentum and trend continuation.
RSI at 72, indicating overbought conditions, but trend remains strong.
Hidden bullish divergence observed on the recent pullback, signaling further upside.
Market Makers completed accumulation in the $126 - $128 zone, now shifting toward markup.
LONG Trade Setup:
Entry: $133.50 - $134.00 zone.
Targets:
T1: $136.00 (first resistance).
T2: $137.00 (next liquidity zone).
Stop Loss: $131.20 (below recent support).
Risk Score:
7/10 – Favorable setup, but overbought RSI suggests potential pullbacks.
Market Maker Activity:
A
ccumulation phase completed, transitioning into a distribution phase.
Clean break above $133.00 confirms institutional interest and trend continuation.
Higher low formation with increasing volume, supporting further bullish momentum.
Strong support established at $131.20, reinforcing the uptrend.
Recommendation:
Long positions remain favorable within the $133.50 - $134.00 entry range.
Scaling in on pullbacks to $133.50 is recommended to optimize entry.
Monitor price reaction at $136.00, as this level may see short-term resistance.
🚀 Follow me on TradingView if you respect our charts! 📈 Daily updates!

SOL/USDT Perpetual Futures
📍 Timeframe: 4H (MEXC Exchange)
📈 Current Price: $133.02 (+0.57%)
Key Technical Insights:
Trending Resistance Breakout Zone:
The price is approaching a key downtrend resistance (red trendline).
A break and close above this resistance could push SOL towards $148–$150 (gray supply zone).
Two Possible Scenarios:
Bullish Breakout:
A breakout above the resistance trendline could lead to a test of the $148–$150 supply zone.
If demand is strong, further upside toward $160+ could follow.
Bearish Rejection:
A rejection at the trendline could trigger a pullback to the curved support (blue line).
A deeper breakdown may test the $110–$115 demand zone (highlighted with a black box).
Rounded Bottom Formation:
The price structure is forming a curved support indicating accumulation.
If buyers sustain momentum, a breakout could be confirmed with strong volume.
Trading Strategy:
Bullish Case: Enter long positions above $136 with confirmation, targeting $148–$150.
Bearish Case: Enter short positions if rejection occurs at $135, targeting $125 or lower.
Risk Management: A stop loss below $128 for long trades and above $136 for short trades.

SOL Spot Idea Sol appears to be in a retest zone of the downtrend. i think It looks good for a spot trades
good entry at 128 and 126

Solana Weekly Chart is Looking Explosive!
😳 300 Days of Accumulation Above Key Support Zone
🐃 Massive Bullish Breakout Confirmed (High Probability Setup)
🔥 Reclaiming Major Resistance Levels & Entering Price Discovery Mode
🎯 Targets:
📌 Short-Term: $222.90
📌 Mid-Term: $316.01
📌 Long-Term: Higher price discovery potential 🚀
If you are not longing #SOL at these levels, you are missing out on a golden opportunity! 📊📈

Solana towards 200 target personal idea: Solana with strong fundamental crashed same as other coins, in my opinion,price below of 140k made good opportunity to buy deep, currently to reach 200, needs to pass 150 and 170 step by step. Good 🙂 luck 👍

SOL : It's timeMarket structure shifted in H1. Looking pretty bullish here (if and only if BTC behaves well). Aiming to capture 6 to 7% move.
Trade is not any kind of financial advice. I'm sharing what I'm doing for myself. If your analysis is something else by all means do it.
GL

Long/sol usdtIf in this here could break out of up solana can be rise and touch those tp in chart ..pay a tention. It should break with power candel

SOL/USDTSOL reached its critical level for a LONG time.
We have formed a 3 times right, swingfailure pattern on the downsloping linechart support level. If this level holds its the moment for a reversal, if it does not we either form a double bottom right under the support for a failed auction where we go back into the pattern, or crypto collapses for a major markdown.
So far based on history and the patterns presented to us in the charts, we have a higher likelyhood to go up. Bitcoin will have its final support at 70k for a decision point to also get back to its 100k+ levels for a continuation of its bulltrend.

SOL Looks Bearish (1D)A major trendline has been lost despite positive news, and SOL is prone to further drops towards the green box.
A large liquidity pool exists below the price, which is likely to be taken out, pushing the price toward the marked zone.
The price structure has turned bearish with a CH on the chart.
A daily candle closing above the invalidation level will nullify this analysis.
For risk management, please don't forget stop loss and capital management
Comment if you have any questions
Thank You

SOL/USDT Technical Analysis: Consolidation After a Sharp DropOn the chart, we can see a strong previous price drop followed by consolidation. The marked zones represent the key resistance area, where the price has faced multiple rejections, and the support area, where several bounces have occurred. Currently, the price is in the middle of this range, indicating liquidity accumulation without a clear direction. A breakout above resistance could signal further recovery, while a breakdown below support could indicate a continuation of the downtrend.

#SOL/USDT#SOL
The price is moving in a descending channel on the 1-hour frame and is expected to continue upward.
We have a trend to stabilize above the 100 moving average once again.
We have a downtrend on the RSI indicator that supports the upward move with a breakout.
We have a support area at the lower boundary of the channel at 121.60.
Entry price: 126
First target: 129
Second target: 132
Third target: 135

Sol trade idea for short SOL has formed buy side liquidity just below the bearish OB and FVG. This is the area where I’m looking for short.

solusdt.p 1hHello dear traders
These entry points are very low risk for trading
You can enter from these points, which are drawn based on logarithmic lines and important high and low
with a stop loss of 10 and based on capital management.
