Lingrid | SOLUSDT Consolidation After KEY Resistance BreakThe price perfectly fulfilled my previous idea . BINANCE:SOLUSDT market has effectively bounced off the support level and continues moving higher. The price has established a significant swap zone around the 135.00 level, where it has repeatedly found resistance or support in previous tests.
Recently, the market broke and closed above the 140.00 resistance zone, and following this breakout, the market has entered a consolidation phase, suggesting it may continue moving sideways in the near term. However, if the price pulls back toward the established swap zone, we can anticipate continuation of the current bullish trend. This consolidation pattern following a resistance break often signals strengthening market conviction before the next meaningful advance. My goal is resistance zone around 165.00
Traders, if you liked this idea or if you have your own opinion about it, write in the comments. I will be glad 👩💻
SOLUSDT.PS trade ideas

Solana's medium term target; the $40 range..!On the daily chart of Solana, based on the equilibrium view and the equilibrium Fibonacci, on April 6, the main zone broke down and in the medium term the candles are moving towards the middle zone and the $40 range.... The equilibrium view of the chart is a macro and big image view of the market and will predict the movement of the candles on the chart, perhaps with a slight delay, but definitely and accurately... The market sentiment will soon change to a downward direction in the medium term... Solana's medium term target; the $40 range..!

Solana Daily Outlook | Key Levels & Market Momentum👀 Welcome to my Trading View Analysis and Trading Channel Here , we share the latest market analysis, trading signals, and key insights together .
Ready for smarter trades ? ⭐️
⚡️Today , we're going to analyze the SOL( Solana ) coin together on the daily timeframe and find triggers for our positions .
💠 🔍Daily Technical Overview
Solana (SOL) recently broke out of its descending trendline on the daily chart, leading to an impressive 30% price surge. This breakout marked a key shift in market sentiment and highlighted a fresh wave of buyer interest.
Currently, SOL is moving through a distribution phase, where price consolidates and profit-taking occurs. All eyes are on the $152.55 resistance level – a breakout above this zone, backed by solid volume, would present a strong long entry opportunity.
📊 🧠 Fundamental Insights
Solana isn’t just showing strength technically – the fundamentals are also aligning for a bullish outlook:
✅ After a 65% correction, buyers are returning to accumulate at discounted levels.
✅ Ecosystem growth continues, with strong developer activity and use case expansion.
✅ Trading volume is on the rise, supporting the price recovery.
📰 🔥 This Week’s Positive Solana News
Here are the major developments from the past week that are giving Solana a strong boost:
📈 Price Forecast: Analysts now project that SOL could reach $155–$160 by the end of May, with potential upside toward $180 in the near term.
🏦 Institutional Investment: Upexi Inc. has announced plans to allocate $100 million toward purchasing Solana tokens — a major show of confidence.
📊 ETF Filing: Franklin Templeton has filed for a Solana-based ETF to track SOL’s price, which could open the door for more mainstream investment.
🇺🇸 US Government Involvement: Reports suggest the U.S. government is considering Solana as part of its strategic digital asset reserve, highlighting its growing legitimacy.
📝 Conclusion
🚀 Trendline breakout = bullish confirmation
📌 Consolidation = distribution zone
📊 Break above $152.55 = long setup
📉 Previous 65% correction = attractive accumulation zone
📰 Positive news flow = fundamental support for continued growth
I love you all so much . 👀
don't forget about capital management and risk management .
Be careful with your positions . 🥇

Going long on SolanaBINANCE:SOLUSDT
Solana has experienced climatic volume to the downside, bullish RSI divergence, and now it seems ready for a big bounce. Also, there is a Hammer candlestick at the bottom of the decline.
Good luck to you

SOLANA (SOL/USDT) – Bullish Flag Forming on 4H!Hey traders!
#SOLANA is currently consolidating sideways and printing a bullish flag pattern on the 4-hour timeframe – a classic continuation signal after a strong upward move! 🚀
Here's the plan:
Wait for a clean breakout above the flag's resistance
Enter on the retest of the breakout level to confirm support
Apply strict risk management and target the next major resistance zone
Watch for increasing volume to validate the move
Why this matters?
The bullish flag often leads to explosive moves when confirmed properly. Don’t chase the breakout — let price come to you. Patience = profits. 🧘♂️
Key Levels & Entry Plan marked on chart
Drop your thoughts below – do you agree with this setup or see it differently?
Like & Follow for more clean, no-hype trade ideas!
#Solana #SOL #CryptoTrading #BullishFlag #TradingView #TechnicalAnalysis #Altcoins #CryptoSetup #BreakoutTrade

SOL Bullish Pendant 2025-05-06 Daily ChartSOL has formed a Bullish Pendant on the Daily Chart: 2025-05-06

SOL Daily – Bullish Break of Structure with Trendline ReversalSolana is currently trading around $146, having broken out of the descending trendline and confirmed a bullish break of structure (BoS) to the upside. This signals a shift in market direction, now favoring long setups.
The price is above the Ichimoku cloud, with Span A at $140.00 and Span B at $126.13, confirming the bullish trend is supported not just by price action but also by momentum structure. The cloud is angled upward, reinforcing that bullish continuation remains the most likely scenario.
The optimal entry zone lies between $126.36 and $112.45, a key support area that previously acted as resistance and has since been validated by multiple reactions. A retracement into this zone would offer a high probability long setup, particularly if combined with a short-term TSI reset or bullish candlestick signal.
The Trend Strength Index (TSI) supports this scenario:
TSI(20): 0.89 — strong bullish momentum
TSI(10): 0.19 — early in the cycle, with potential for expansion
The main bullish target is $256.00, which aligns with the next macro resistance zone and offers a risk-to-reward ratio 1:4.
Trade Setup Summary:
Entry Zone: $126.36 – $112.45
Target: $256.00
Stop Loss: Below $95
Solana remains one of the top-performing Layer 1 blockchains in terms of throughput, user activity, and developer interest. Its low fees and high speed have supported growing ecosystems in DeFi, NFTs, and consumer apps. Despite past setbacks, recent improvements in network stability and increased institutional attention have reignited bullish sentiment. With the market shifting into broader altcoin rotation, Solana is well-positioned to benefit from renewed investor flows.
Disclaimer: This content is for educational and informational purposes only. It does not represent financial advice or a recommendation to buy or sell any financial instrument. Trading involves risk, and you should only trade with money you can afford to lose.

SOL Trade Setup – Structure Shift & Higher Low FormationSolana (SOL) has shown significant strength after deviating below range lows and tagging $95, quickly recovering and reclaiming key support, indicating a bullish structural shift. We’re now watching for a retrace into the $120 zone, which could confirm a higher low and set up a strong medium-term long entry.
🔹 Entry Zone:
Around $120
🎯 Take Profit Targets:
🥇 $162
🥈 $187
🥉 $213
🛑 Stop Loss:
Daily close below $110

Solana Ready For The Pullback?BINANCE:SOLUSDT is printing a clean head and shoulder here. If price breaks and hold below $145 i think it may go for a pullback.

Long tradeSOLUSDT (Buy Side)
🗓 Date: Monday, 5th May 2025
⏰ Time: 12:30 PM
📍 Session: London AM
Pair: SOL/USDT
📈 Direction: Long (Buy Side)
Entry Price: 143.920
Take Profit: 146.443 (+1.75%)
Stop Loss: 143.740 (−0.13%)
Risk-Reward Ratio: 14.02
Reason: Based on observation of price action and momentum to the upside, as well as observing ETH and BTC served as confirmation to the buyside trade.
15min TF overview

SOLUSDT - Quadruple Bottom SupportVery solid support line in green horizontal
This has been tested at least 4 or more times on this daily timeframe
Very bullish for Solana

Solana vs Ethereum – A Meme War or Market Shift?🔥⚔️ Solana vs Ethereum – A Meme War or Market Shift? 🧠📉
It’s getting spicy out here in the crypto arena... and the memes are hitting just as hard as the market caps! 💥
Over the weekend, Solana briefly flipped Ethereum in total staking value — triggering a fiery debate on whether that’s bullish or bearish for SOL. Some celebrated the milestone 🥂, while others, especially from the ETH camp, argued it reveals a deeper problem: Solana’s staking isn't really staking (as slashing isn’t automatic, and network restarts are still a thing). 🛑🔧
📸 Bonus Meme: Apparently Ethereum’s new logo is now Internet Explorer 😂 — can’t say the UX didn’t earn it.
🧠 The FXProfessor’s Technical Take: Let’s cut through the noise.
📉 SOLETH (Solana vs Ethereum Ratio)
Rejected at grand resistance: 0.088
Projected drop: -28% to 0.063
Structure: Bearish inside an ascending channel (highlighted in orange)
📊 ETHUSD
Support: $1,530
Rebound potential: $1,650 and beyond
Long-term structure still forming — this could be a spring.
📈 SOLUSD
Key support: $114
If that breaks higher, next test is $179, then $215
But failure at this level opens room for downside re-test near $80
💬 So where do we stand? On chart structure alone, Solana might still outperform ETH short-term — but technically, SOLETH suggests a correction is due.
🧑🏫 Yes, I’m emotionally attached to Ethereum — I have build on it, invested in it, got smashed on it for months..pain, at least for now. But I trade what I see (or at least i try damn it!)
Let the memes roll, but let the charts speak. Drop your thoughts — SOL or ETH? 👇
One Love,
The FXPROFESSOR 💙

SOLANAThis is just to show you how I look for my entries in my trading strategy. Please do not copytrade or market enter in solana after seeing this. This is purely an educational post for you to see so if you want, take notes and later apply and win!
Thanks for reading : )

SOLOn CRYPTOCAP:SOL you can see the support zone I mark out. Take them as POI and watch PA closely when it reaches them. When I see a proper confirmation on either of the support levels you see on the chart I will announce it asap and notify you guys about my entry.
Remember to always use a stop loss and proper take profit to eliminate emotions and secure the profits.
Goodluck!
I always appreciate a follow, it keeps me going :) thanks!!!

Solana (SOL): Gameplan Remains The Same | Aiming at $100 Solana's game gameplan has not changed for us, where we are still looking for that downward movement to form a proper support zone near the psychological area at $100.
More in-depth info is in the video—enjoy!
Swallow Academy

SOLUSDT SHORT IDEAUnder current market conditions, the area near 148.3 has been identified as a critical resistance zone, where the AI model detects a high-probability trade setup.
From a technical perspective, a clear directional bias based on recent price action patterns. Suppose the market demonstrates increased volume and price stability above key moving averages in the 148.3 area. In that case, traders are advised to monitor for trend-continuation entry opportunities in alignment with the prevailing momentum.
Profit targets are defined at 145.0 and 140.2, corresponding to logical technical support zones. These levels are designed for staged profit-taking across different trade management styles. Stop-loss should be strictly enforced at the designated level; once breached, the strategy is considered invalidated in order to limit potential downside.

[SOL] 2025.04.18***Follow SEOVEREIGN to receive real-time alerts.
**Boosts help SEOVEREIGN continue analyzing more assets.
**Our team regularly publishes in-depth reports on the cryptocurrency market.
Since forming a bottom at 123.55, SOLANA has been showing signs of a steady recovery.
The current chart structure suggests the emergence of a Cup and Handle pattern, which is often interpreted as a signal for a potential medium-term bullish reversal.
However, entering a position at this stage may be slightly premature, as a brief period of pullback is likely before a more significant upward move begins.
Projected target levels are as follows:
First target: 139.80
Second target: 141.33
Third target: 143.94
After a moderate consolidation, SOLANA is expected to follow a gradual upward trajectory in line with the Cup and Handle structure, potentially reaching the listed targets in sequence.

SOL ANALYSIS🔮 #SOL Analysis 🚀🚀 Update
💲💲 As we said #SOL performed the same. #SOL is trading in a Ascending Broadening Wedge Pattern and there was a breakdown of the pattern. Now we can expect a breakout of the resistance and a bullish move
💸Current Price -- $151
⁉️ What to do?
- We have marked crucial levels in the chart . We can trade according to the chart and make some profits. 🚀💸
#SOL #Cryptocurrency #DYOR

SOL Targets $175 With 20% Surge From Key SupportHello and greetings to all the crypto enthusiasts, ✌
All previous targets were nailed ✅! Now, let’s dive into a full analysis of the upcoming price potential for Solana 🔍📈.
Solana is currently trading within a strong descending channel. I anticipate a potential 20% price increase in the coming days, targeting the $175 level and a possible breakout to the upside. A key daily support zone has also been highlighted on the chart to provide additional context.📚🙌
🧨 Our team's main opinion is: 🧨
Solana’s stuck in a strong downtrend, but I’m eyeing a 20% bounce to $175 and a breakout soon—plus there’s a key support zone marked on the chart to watch.📚🎇
Give me some energy !!
✨We invest hours crafting valuable ideas, and your support means everything—feel free to ask questions in the comments! 😊💬
Cheers, Mad Whale. 🐋

SOL in coming weeksThe SOL will increase $150 and reach to the top of the wedge in the coming weeks .
Give me some energy !!
✨We spend hours finding potential opportunities and writing useful ideas, we would be happy if you support us.
Best regards CobraVanguard.💚
_ _ _ _ __ _ _ _ _ _ _ _ _ _ _ _ _ _ _ _ _ _ _ _ _ _ _ _ _ _ _ _
✅Thank you, and for more ideas, hit ❤️Like❤️ and 🌟Follow🌟!
⚠️Things can change...
The markets are always changing and even with all these signals, the market changes tend to be strong and fast!!

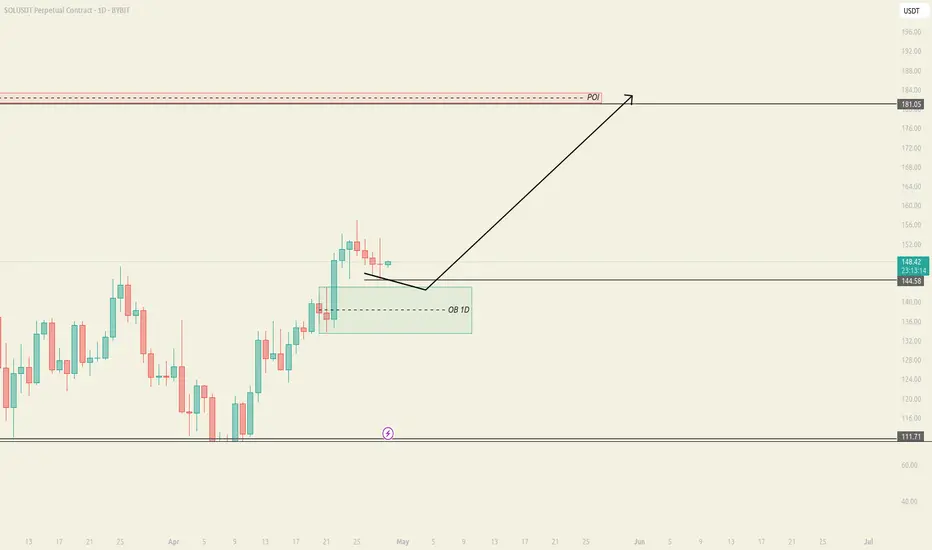
SOL 181-182 TARGETSOL on the daily chart it looks like a bull.
The optimal entry will be after removing liquidity at 144.58 with the target 181-182
Solana's rise is not long-term...On the 4-hour Solana chart, there is also confirmation of the downward movement of the candles... Based on the candle structure in the 4-hour timeframe, the main zone breakdown is confirmed again and the candles are moving to the $40 range in the medium term... In addition, the pale green equilibrium line has been broken and the candles will soon touch the bright green dynamic equilibrium level... Solana is not bullish in the medium term and the equilibrium analysis tells us that we may have growth in the short term, but we will move downward in the medium term... Solana's rise is not long-term and we will reach the $40 range...

SOL 2025.04.29***Follow SEOVEREIGN to receive real-time alerts.
**Boosts help drive SEOVEREIGN to deliver more in-depth analysis across various assets.
**Our team regularly publishes detailed reports on the cryptocurrency market.
We would like to formally announce that we are shifting from the long (buy) perspective we have consistently maintained up until the 22nd, to a short (sell) perspective for the near term.
After a thorough and multifaceted analysis of the current market conditions, we have concluded that a strategic adjustment in positioning is now necessary.
From a technical standpoint, Solana (SOL) appears to have completed its 5th wave. Notably, the length of the 5th wave corresponds precisely to 0.618 times the range from Wave 1 through Wave 3 — a textbook formation under Elliott Wave Theory.
Such a structure goes beyond ordinary price fluctuations, signaling that the market is approaching a critical inflection point. In light of this, we believe it is time to seriously consider short positions.
The target price we are presenting is as follows:
Target: 136
As always, the market is subject to various unpredictable variables. Rigorous risk management and flexible strategy adaptation are not just recommended, but essential.
Riding the waves of the market is never a matter of mere luck — it is achieved only through meticulous preparation and composed execution.
Even at this very moment, the market demands constant decisions.
Be cautious, but not fearful; be bold, but never reckless.
We trust that each of you will make wise and well-grounded decisions based on your own convictions and analyses.
